
Summary
This chapter we covered:
- Various types of multivariate maps such as multivariate choropleth, multivariate dot/proportional symbol maps, cartograms, and multivariate glyphs.
- Multivariate color schemes.
- Visualizing uncertainty.
Creating multivariate maps might be more complex, but it is a powerful tool in giving a more nuanced analysis of a particular trend. If you are looking form ore opportunity to learn how to create multivariate maps beyond the assigned lab, please check out the ESRI Multivariate Maps tutorial.
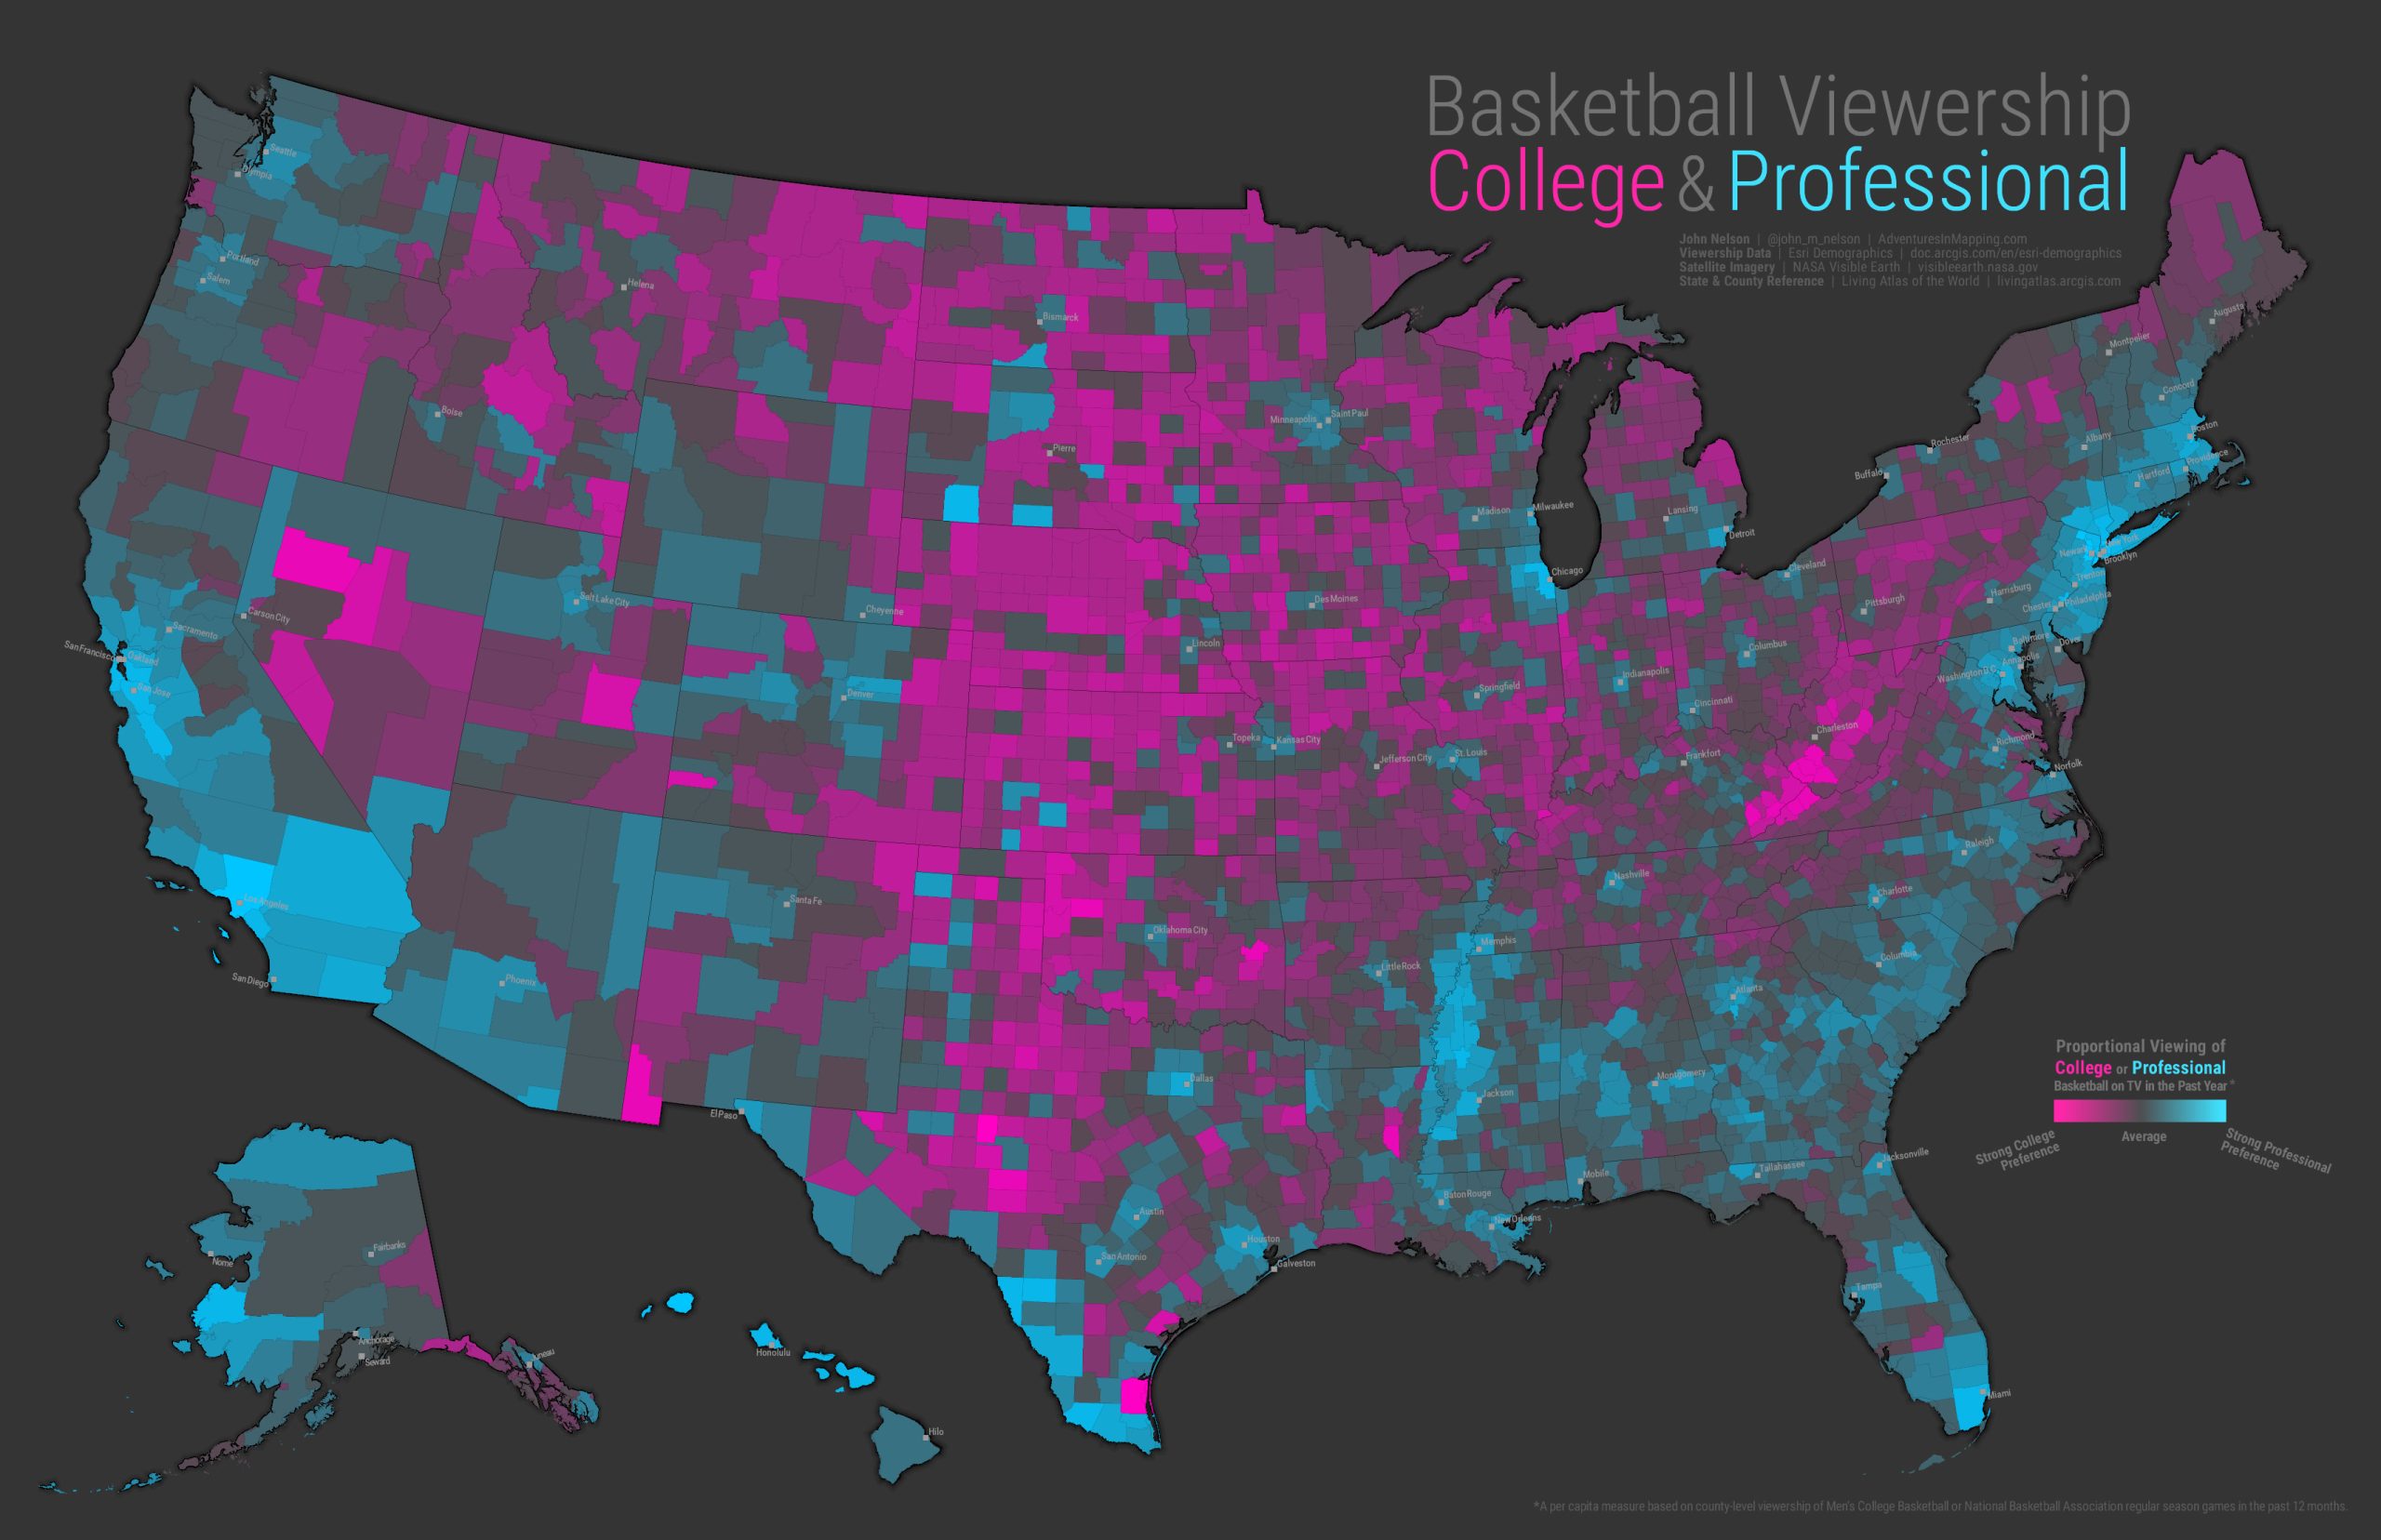
Image source: ESRI
