
Basemaps: Leveraging Location
Basemaps: Leveraging Location
Basemaps are essential – they provide the context for your map data. Selecting a basemap should never be just an afterthought, and though the final choice is always subjective, you can make a better decision by considering your map purpose, audience, and the nature of your overlay data.
Street Maps
Often the default basemap used in business web-mapping applications. Helpful when highly-detailed locational context is necessary (particularly for navigation). Though pre-designed street basemaps may not have the ideal aesthetic for overlaying complex data, they are particularly useful at large scales (at which they appear less visually cluttered) or when overlaying relatively simple social data (e.g., for a map showing all locations of a restaurant chain).
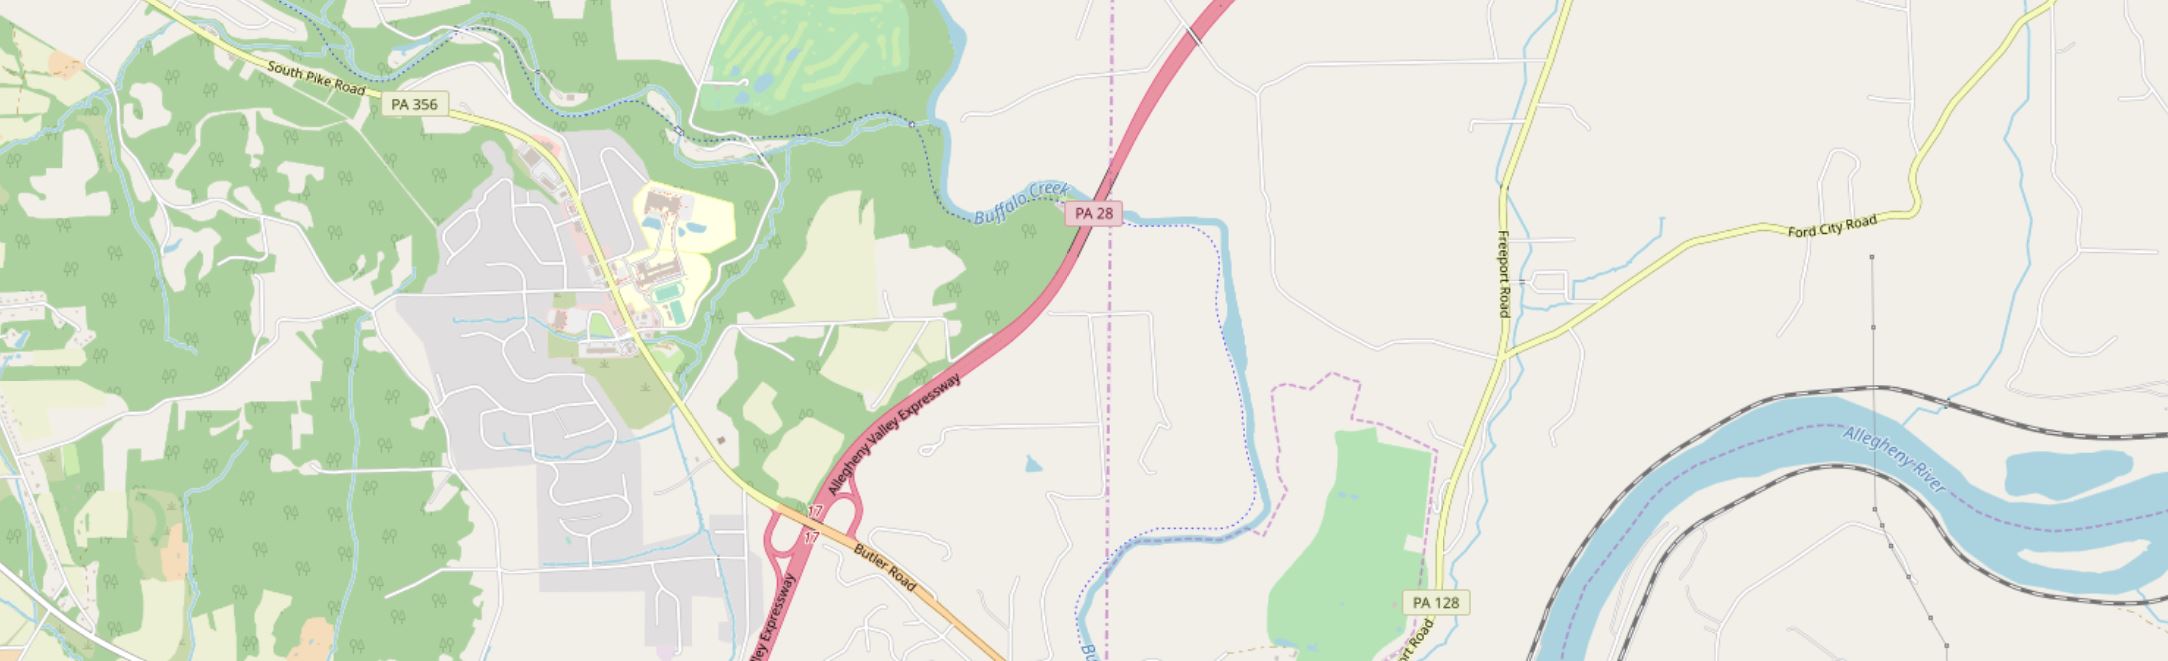
Image description: The image is a map that depicts a geographical area with a mix of residential, natural, and transportation features. The left and lower left sections of the map show a region dominated by large green areas, indicating forests or parks, interspersed with lighter, irregularly shaped patches representing cleared land or water bodies.
Near the center, there are clusters of grey and white lines, representing a dense network of smaller streets within a residential or urban area. This cluster is bordered by green areas.
Prominent roads are highlighted, such as PA 356 running horizontally near the top, and PA 28, a prominent red road running vertically, intersecting with PA 356. Butler Road and the Allegheny Valley Expressway (also marked PA 28) are in yellow and continue southward. The latter connects with a major interchange indicated by loops and curves.
To the far right of the map, there is another stretch of highlighted road, extending diagonally, labeled Ford City Road, and another smaller route labeled Freeport Road. The map also shows a large blue river, the Allegheny River, flowing horizontally from left to right near the bottom right. The river twists and turns, showing its natural, meandering course. The background color of the map is predominantly beige.
Satellite Imagery
Often useful for environmental or engineering applications. May be useful in rural areas that cannot be well-understood using street maps (as few streets exist). The colors and detail make overlay data much more challenging to design than over subtle basemaps – satellite basemaps work best when GIS data is structured and simple and understanding the physical structure of the landscape is essential to the mapping function (e.g., for a map of local water pipelines).
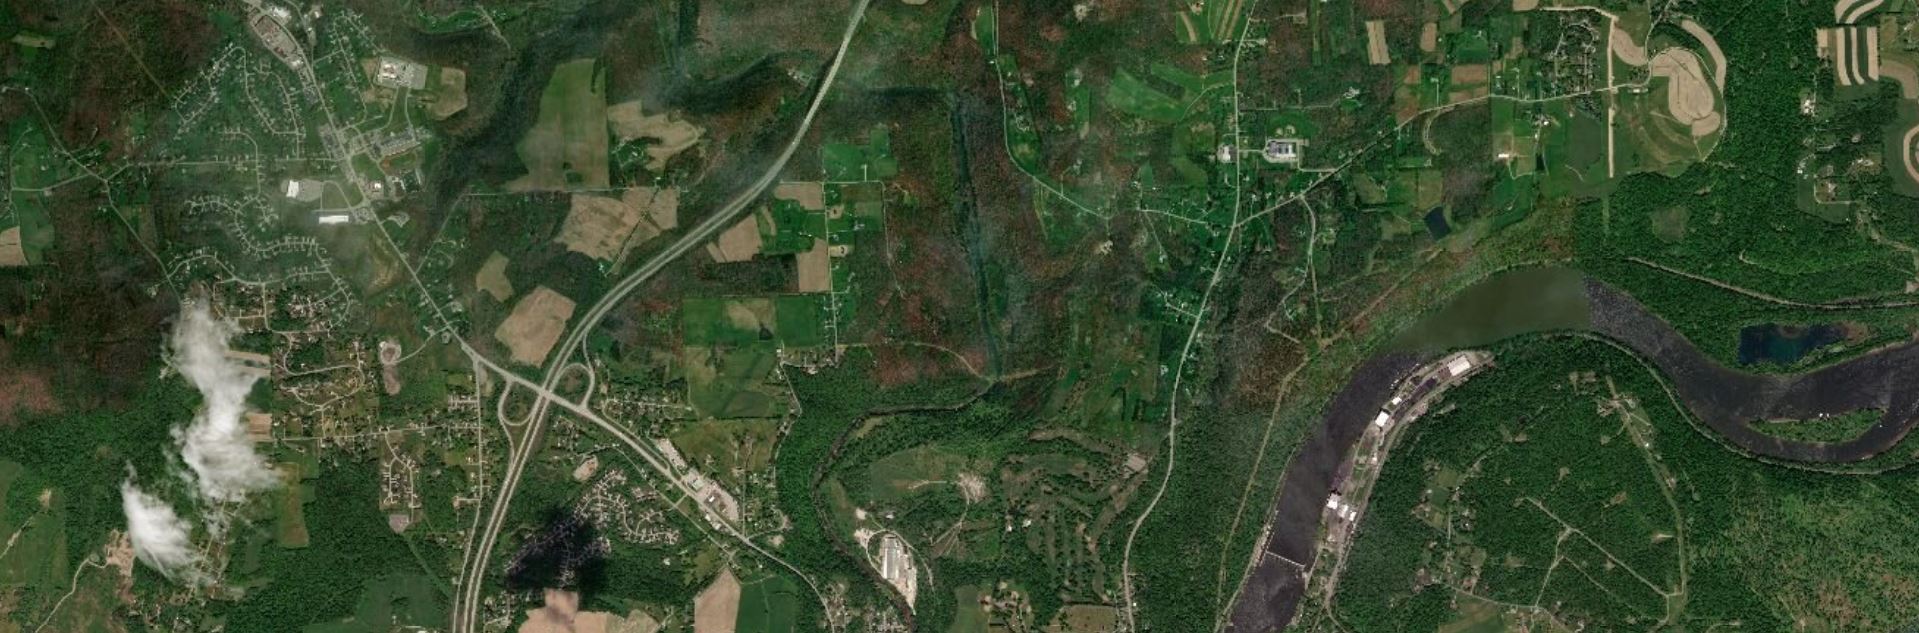
Image description: The image is an aerial satellite view of a landscape characterized by a mix of residential areas, roads, farmland, a river, and forested regions. In the upper-left quadrant, there are clusters of houses arranged along winding roads, with some straight sections creating blocks. Moving towards the center, there is a prominent intersection of two major highways, forming a cloverleaf interchange. To the right of the interchange, the landscape primarily consists of agricultural fields with visible plots of land in various shades of green and brown. The bottom part of the image shows sections of dense forests and scattered patches of farmland. The right side of the image features a wide, winding river passing through the landscape, with some buildings situated along its banks. A mix of vegetation, developed areas, and water bodies dominates the overall scene.
Greyscale Basemaps
Usually reserved for thematic mapping, greyscale basemaps are helpful when the intended audience already knows the location context, or when significant detail is not important to fulfill the map’s purpose. The simple backdrop adds visual emphasis to your overlay data – especially important for maps produced for entertainment or maps whose primary focus is statistical data (e.g., statistical mortality maps). Choose a light or dark background based on the content and mood of your map, and design overlay data accordingly.
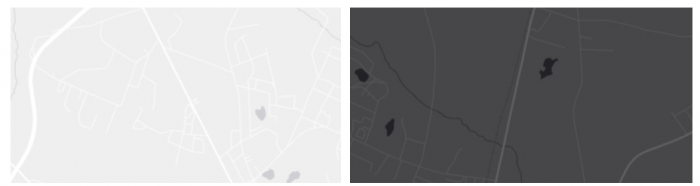
Image description: The image is a side-by-side comparison of two maps, each occupying half of the frame horizontally. The left map features a light gray background with white lines denoting roads and faint, gray shapes indicating bodies of water. The right map has a dark gray background with lighter gray and white lines representing roads and black shapes indicating similar geographic features as the left map. Both maps include a variety of intersecting and curved lines representing a network of roads and infrastructure in the depicted areas, but with notable contrast differences between the two maps.
Terrain Basemaps
Terrain basemaps are particularly useful when the terrain of the landscape has an important relationship with the data being mapped (e.g., mapping wildfires; hiking maps). Shaded relief also adds visual interest and, when done well, creates a beautiful map. Just be sure to not let the basemap content overwhelm your own data.
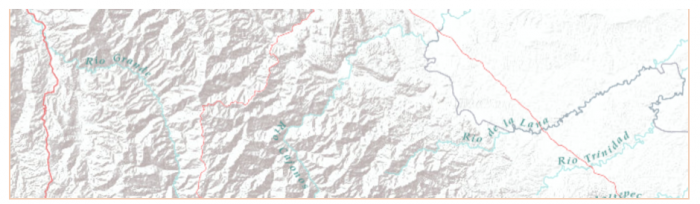
Image description: A terrain basemap section showing a terrain characterized by multiple river systems and mountainous ridges. The rivers are marked with blue lines and labeled with names. Red lines demarcate certain borders or boundaries. The map features varying shades of gray to represent elevation changes and the contours of the mountain ranges. The rivers identified include “Rio Grande,” “Rio Conchos,” “Rio San Fernando,” “Rio Tamesi,” “Rio Soto la Marina,” “Rio de las Palmas,” “Rio Pánuco,” and “Rio Trinidad.” The rivers flow through a rugged landscape with marked elevation that is visualized through densely packed contour lines and color gradations.
A comparison of several example basemaps at the same location in Chicago are shown below in Figure 1.5.5. As shown, different basemaps can have vastly different overall looks, as well as differing levels of detail (LOD).
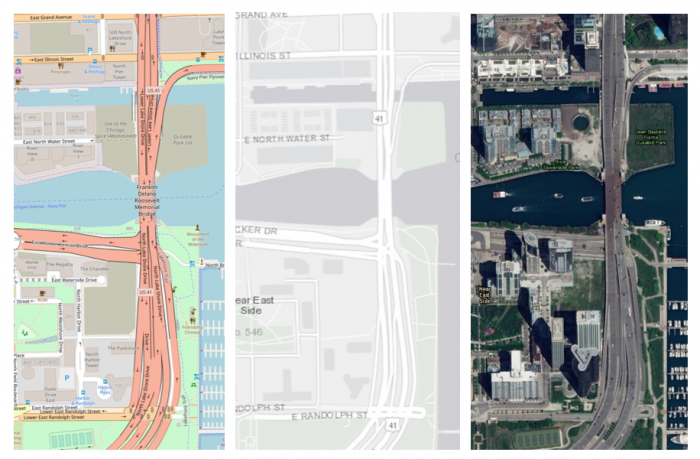
Image description: The image is divided into three vertical panels. The left panel is a detailed map showing streets, buildings, and landmarks with a variety of colors and labels. The center panel is a grey-scale map depicting streets and areas but with much less detail and no labels. The right panel is a satellite image showing a bird’s-eye view of an urban area with buildings, streets, and a waterway.
When making a map, your basemap sets the tone – everything else builds from this important beginning.
Student Reflection
There are many more options for basemaps than the defaults available in ArcGIS Pro, though they are a great place to start. Have you used any mapping applications that you felt had an exceptionally-designed basemap?
Check out some more creative, exciting basemaps in the Mapbox Gallery!
There are many creative possibilities – visit Mapbox’s selection of Designer Maps.
