
Creating Symbols with Labels
We learned about visual variables in Lesson One and applied those ideas to create general purpose maps. For example, you might have used different line weights to create hierarchies of road features, or different hues and/or patterns to differentiate between types of waterbodies. In this lesson, we apply these same ideas to text.
Student Reflection
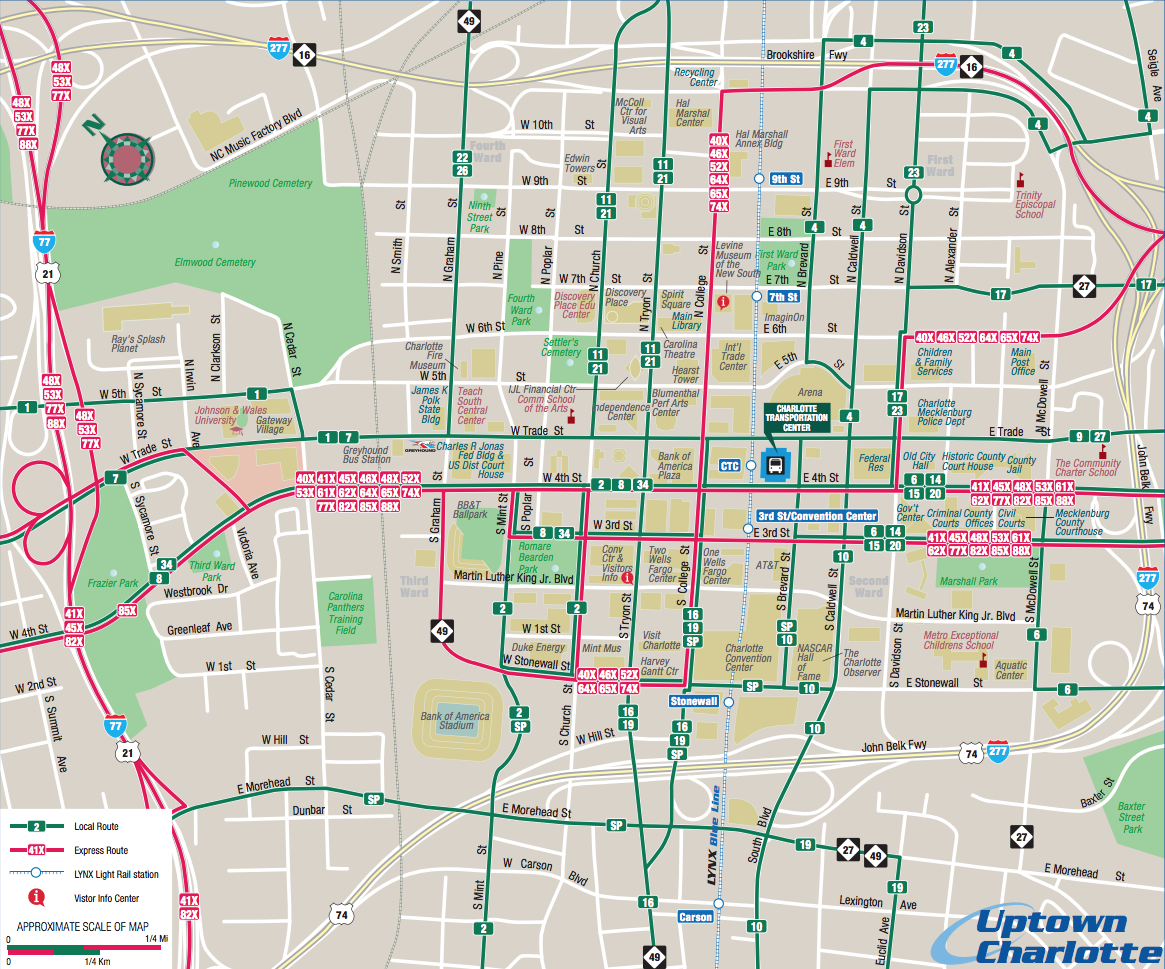
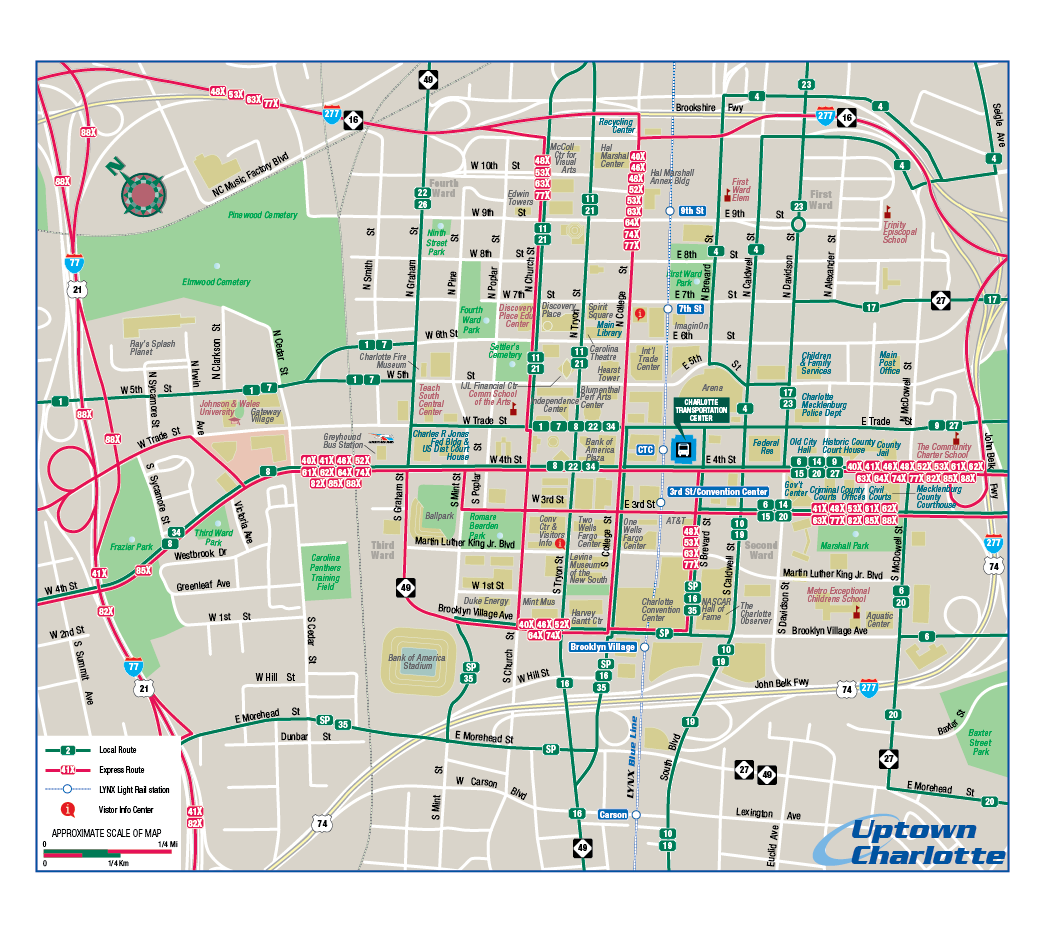
Look at the labels on the map in Figure 2.3.1. Which show categorical differences from others? Which show order differences? Which show both?
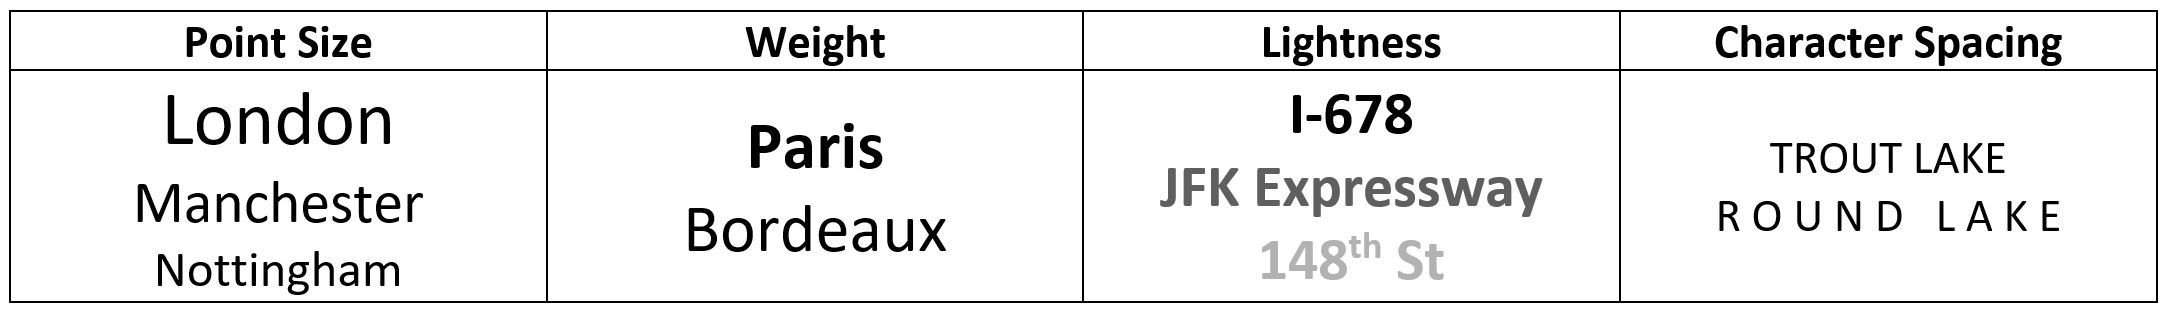
When designing labels to show order (e.g., population size, (road) speed limit), choose text characteristics that demonstrate differing levels of importance, such as those shown in Figure 2.3.2.
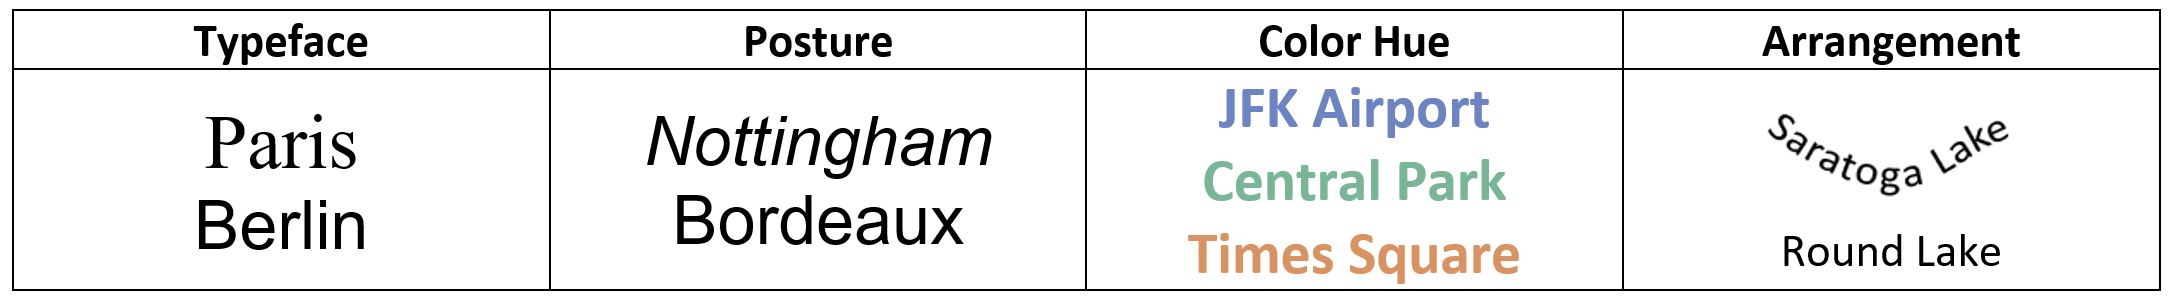
When designing labels to demonstrate category, choose text characteristics that demonstrate difference, but not importance or order (Figure 2.3.3).
As with symbol design, it may often be prudent to use both types of characteristics together—creating labels that show both order and category. When designing labels, be cautious to attend to the aesthetics of your map, and avoid over cluttered or overcomplicated design. It often looks messy to use more than two fonts on a map, so try to stick to two: as noted previously, pairing a serif and a sans-serif font that look good together often does the trick.
