
Designing for Multiple Scales
Another important decision you will have to make when mapping is at what scale your map should be designed. When designing your symbols, you should always take scale into consideration. Generally, large-scale (zoomed-in) maps should include more features, such as local roads and points of interest, while small-scale maps should be simpler, to avoid visual clutter.
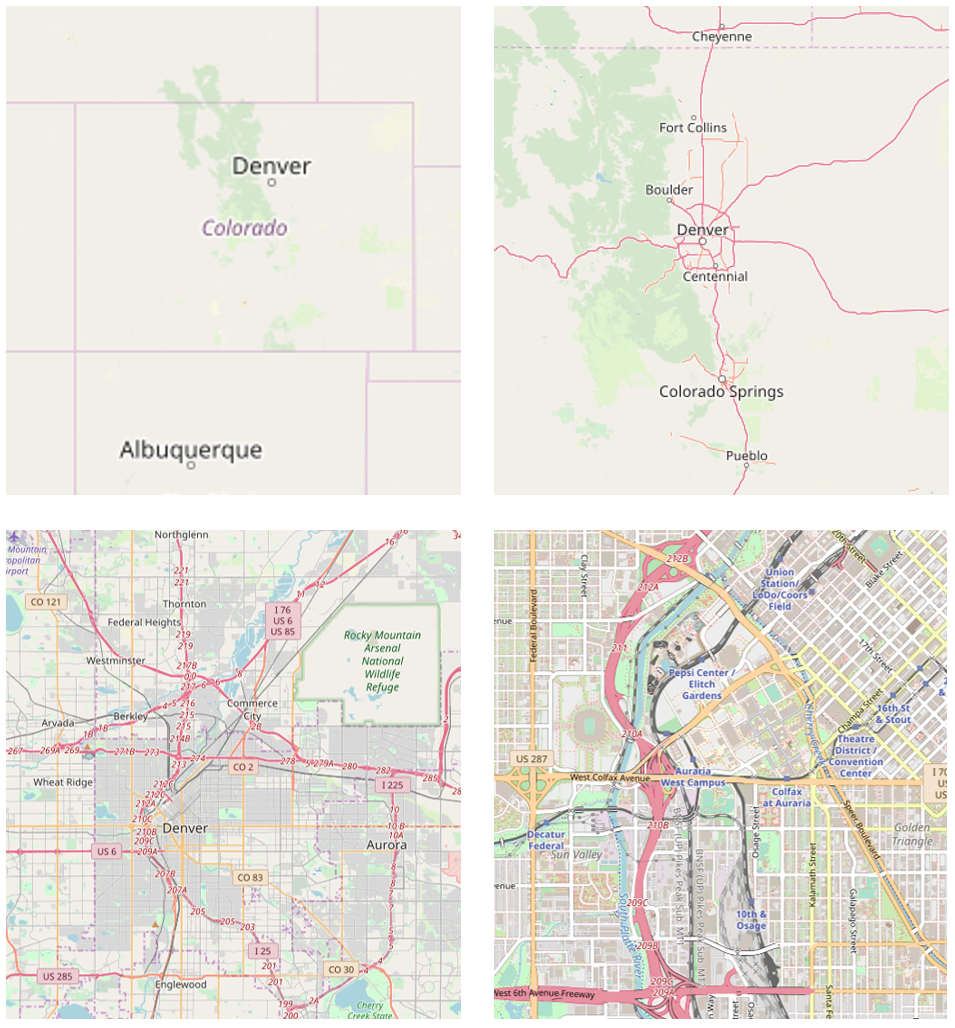
Image description: The image is a composite of four maps arranged in a 2×2 grid, showing various levels of detail for the area surrounding Denver, Colorado.
Top Left: A large-scale map showing the states of Colorado and part of New Mexico. Major cities like Denver and Albuquerque are labeled, with Denver centered in the map. The map highlights state boundaries with purple lines.
Top Right: A more detailed map of Colorado showing several cities connected by highways. Key cities labeled include Cheyenne, Fort Collins, Boulder, Denver, Centennial, Colorado Springs, and Pueblo. Major highways are depicted in red lines.
Bottom Left: A regional map focusing on the metropolitan area surrounding Denver. This map highlights highways, major roads, and neighboring cities such as Thornton, Westminster, Arvada, Wheat Ridge, Aurora, and Englewood. It includes the Rocky Mountain Arsenal National Wildlife Refuge.
Bottom Right: A highly detailed street map of downtown Denver. It shows specific landmarks including Union Station, Pepsi Center, Elitch Gardens, the Theatre District/Convention Center, and Auraria West Campus. Streets and highways are clearly marked, with a focus on the arrangement of the urban grid and prominent features.
Student Reflection
What do you see at the four different scales shown in Figure 1.8.1? What features are prominent at the smallest scale (top left)? What features do not appear until the largest scale (bottom right)?
Web-based basemaps, such as the one shown in Figure 1.8.1, are often designed to adjust the level of detail automatically, as the user adjusts the map’s scale. If you are mapping your own data over a web map, however, you will still need to make decisions about the level of detail you include at each scale, as well as the sizes and styles of your symbol designs.
