
Lab 1 Visual Guide
Lab 1 Visual Guide Index
- Choosing a city for your City Story Dataset
- Downloading Census Data
- Creating a new project
- Data preparation
1. Choosing a city for your City Profile Dataset
You will need to choose a city of interest for your City Profile dataset. For the purposes of Lab 1 and Lab 2, we will use Cleveland for our example city. The cities will vary throughout the lab exercises to give you exposure to different datasets. Do not choose cities that are used as examples in the Visual Guides.
2. Downloading Census Data
Now that we have chosen our city, it’s time to download the pertinent Census Data. To build our City Profile dataset, we will need to download boundaries, transportation and hydrology shapefiles. Create a folder and name it “cityname_data.” For example, the data folder that will contain the data pertaining to Cleveland will be called “cleveland_data.” In that folder, create sub-folders called “boundaries,” “transportation,” and “hydrology.”You will need to make sure to download the most recent datasets. For example, at this time, the most current dataset for the U.S. TIGER/Line shapefiles are the 2023 shapefiles.
Boundary shapefiles
Make sure that you put your downloaded data into the “boundaries” sub-folder and that the folders are unzipped.
State, County, and Census Tract boundaries
We will need to download the city boundary for Cleveland along with the Ohio county, state, and Census tract boundaries. We will not use the Census tract boundaries for this lab, but for Lab 3. Go to the U.S. Census Bureau Tiger/Line Shapefiles website and download the relevant boundary files. On the Census Bureau Tiger/Line Shapefiles website, the state and county data comes as a national file. You will need to select by attribute (it is recommended to use the state FIPS code) and export the selection into shapefiles for your city of interest. For the Census tract boundaries, you will be able to select by state.
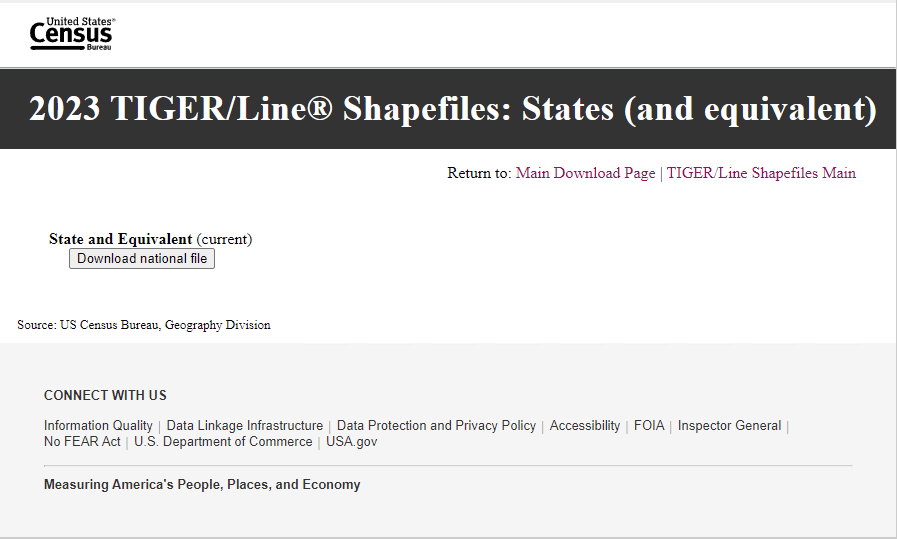
Image description:
United States Census Bureau download page for downloading 2023 TIGER/Line® shapefiles for states and equivalent entities. The page has a simple layout with a header, main content area, and footer.
Header:
- At the top, it features the United States Census Bureau logo on the left.
- Below the logo, there’s a black banner with white text displaying the title “2023 TIGER/Line® Shapefiles: States (and equivalent).”
- Near the title are links in smaller pink text that say “Return to: Main Download Page | TIGER/Line Shapefiles Main.”
Main Content Area:
Below this banner is a section labeled “State and Equivalent (current)” with a button to “Download national file.” At the bottom, in small grey text, it says “Source: US Census Bureau, Geography Division.”
Footer:
Further down, a grey box contains the “CONNECT WITH US” section with links to Information Quality, Data Linkage Infrastructure, Data Protection and Privacy Policy, Accessibility, FOIA, Inspector General, No FEAR Act, U.S. Department of Commerce, and USA.gov. Below these links, there is a tagline stating, “Measuring America’s People, Places, and Economy.”
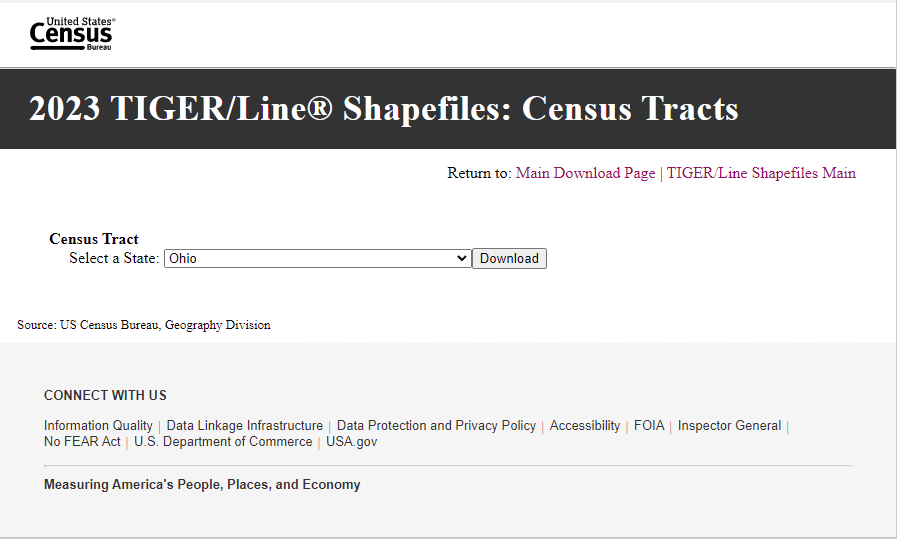
Image description: U.S. Census Bureau webpage for downloading 2023 TIGER/Line® Shapefiles for Census Tracts. The page has a simple layout with a header, main content area, and footer.
Header:
- At the top left corner, there is the “United States Census Bureau” logo in black and white.
- Below the logo, there’s a horizontal black band containing the title “2023 TIGER/Line® Shapefiles: Census Tracts” in white font.
Main Content Area:
- Below the title, there are two hyperlinks in smaller font: “Return to: Main Download Page | TIGER/Line Shapefiles Main,” with the second link in magenta color.
- A dropdown menu labeled “Census Tract” with the options “Select a State” and “Ohio” is present. Next to it is a gray “Download” button.
- Text below the dropdown menu reads “Source: US Census Bureau, Geography Division.”
Footer:
- A section titled “CONNECT WITH US” includes multiple hyperlinks: Information Quality, Data Linkage Infrastructure, Data Protection and Privacy Policy, Accessibility, FOIA, Inspector General, No FEAR Act, U.S. Department of Commerce, and USA.gov.
City boundary
Many cities have a GIS or Open Data portal. Do an internet search to find the data portal of your city. The City of Cleveland has an open data portal which has various types of data such as health data, public safety data, and transit data. This open data portal also contains data products such apps and maps, dashboards and analytics, and data stories. The city boundary shapefile is found under the Locations & Boundaries category of the open data portal.
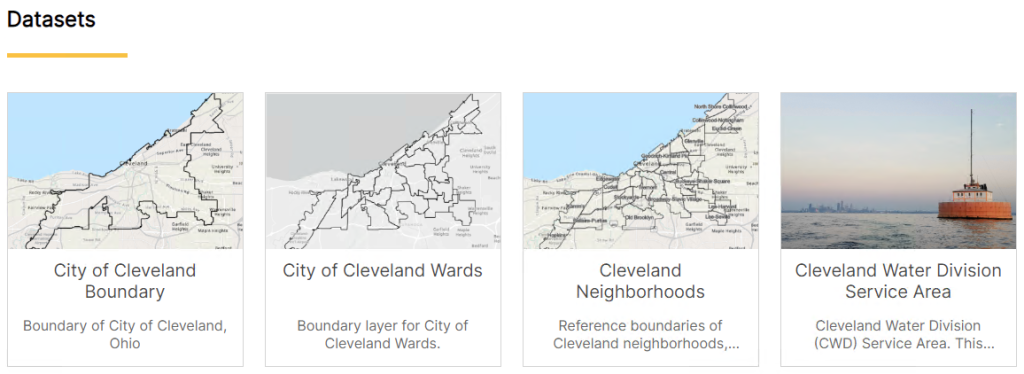
Image description: The Cleveland open data portal comprising four sections under the heading “Datasets.” Each section includes a map or photograph, as well as a title and description. The sections are arranged in a single row from left to right.
- First Section:
- Image: A map showing the boundary of the City of Cleveland, Ohio, with a light blue background.
- Title: City of Cleveland Boundary
- Description: Boundary of City of Cleveland, Ohio
- Second Section:
- Image: A map delineating the wards within the City of Cleveland with a light gray background.
- Title: City of Cleveland Wards
- Description: Boundary layer for City of Cleveland Wards.
- Third Section:
- Image: A map showing the reference boundaries of Cleveland neighborhoods, also with a light blue background.
- Title: Cleveland Neighborhoods
- Description: Reference boundaries of Cleveland neighborhoods,…
- Fourth Section:
- Image: A photograph of a water body, presumably Lake Erie, with a distant view of the city skyline and a water intake station.
- Title: Cleveland Water Division Service Area
- Description: Cleveland Water Division (CWD) Service Area. This…
Put all your boundary files in the “boundaries” sub-folder and unzip the folder.
Transportation shapefiles
You will need to download roads and rail line shapefiles from the U.S. Census Bureau TIGER/Line Shapefiles website. Put the files in the “transportation” sub-folder and make sure to unzip the files.
Roads
On the U.S. Census Bureau TIGER/Line Shapefiles dropdown menu, click on Roads. Under Select a State, select the state your city is in. You need to download All Roads. You will need to select the state and the county that your city is in.
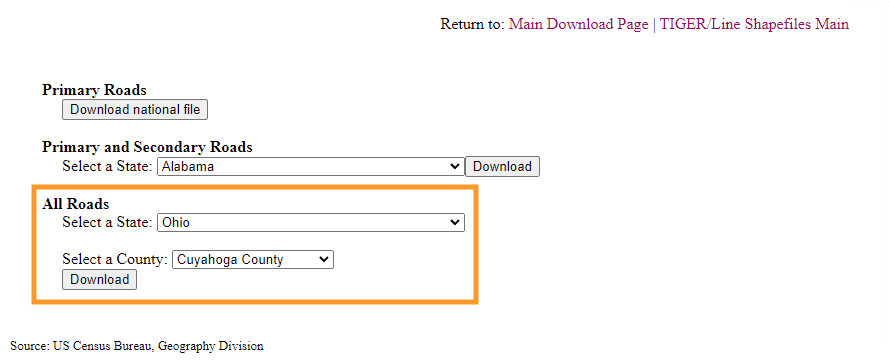
Image description:
US Census Bureau, Geography Division, TIGER/Lines download page displaying options for downloading road data files. At the top center, two small hyperlinks in red text provide navigation options: “Main Download Page” and “TIGER/Line Shapefiles Main.” Below are two grouped sections for downloading road data.
The first section, labeled “Primary Roads,” contains a single button labeled “Download national file.”
The second section, titled “Primary and Secondary Roads,” includes a dropdown menu labeled “Select a State” with “Alabama” selected, followed by a “Download” button.
Below this is a distinct box outlined in orange highlights the “All Roads” download dropdown menu. It has two dropdown menus: the first is labeled “Select a State” with “Ohio” selected, and the second is labeled “Select a County” with “Cuyahoga County” selected. There is a “Download” button below these selections.
At the bottom of the image, the source of the information is cited as “US Census Bureau, Geography Division.”
Rails
The Rails shapefile only comes as a national file.You will need to select by attribute (it is recommended to use the state FIPS code) and export the selection into shapefiles for your city of interest.
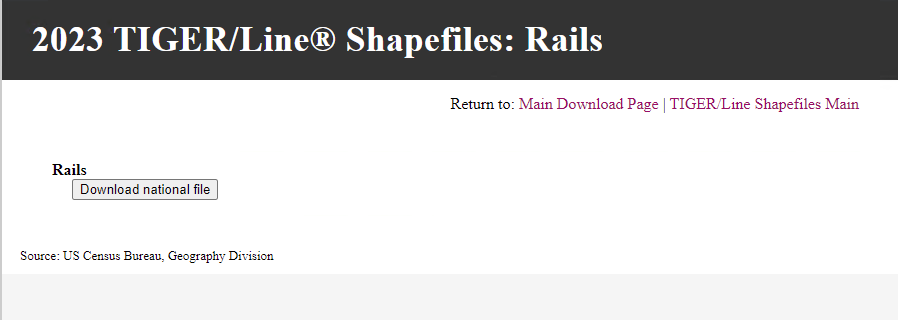
Image description: U.S. Census Bureau TIGER/Line download page showing the download prompt for a national file for railway shapefiles. The page has a simple and clean design with a header and several pieces of text. The header, which is set against a dark gray background, reads “2023 TIGER/Line® Shapefiles: Rails” in large white font. Below the header, the main content area has a white background. On the right side of the page, there is a line of text in smaller font that reads “Return to: Main Download Page | TIGER/Line Shapefiles Main,” with the second and third parts of the text in pink. Below that, there is a section titled “Rails” with a single clickable button labeled “Download national file.” At the bottom of the page, it is noted that the source is the US Census Bureau, Geography Division.
Hydrology shapefiles
We will be using the National Hydrography Dataset (NHD) for the hydrological features. It is important to note that as of October 1 2023, this dataset will no longer be maintained and the most current data will be available through the 3D Hydrography program. For the sake of simplicity, we will be using the NHD to map the hydrological features. You can download the data from the Access National Hydrography Products section of the US Geological Survey (USGS) website. There are various ways to access this data, but the easiest way is to scroll to the Downloading Datasets section and click on Download the NHD by State under Download Option 1: Downloadable Product Directories. You can access the geodatabase for the state that your city is in at the Staged Products Directory. Scroll down to your state of interest and click on the _GDB.zip file for your state.
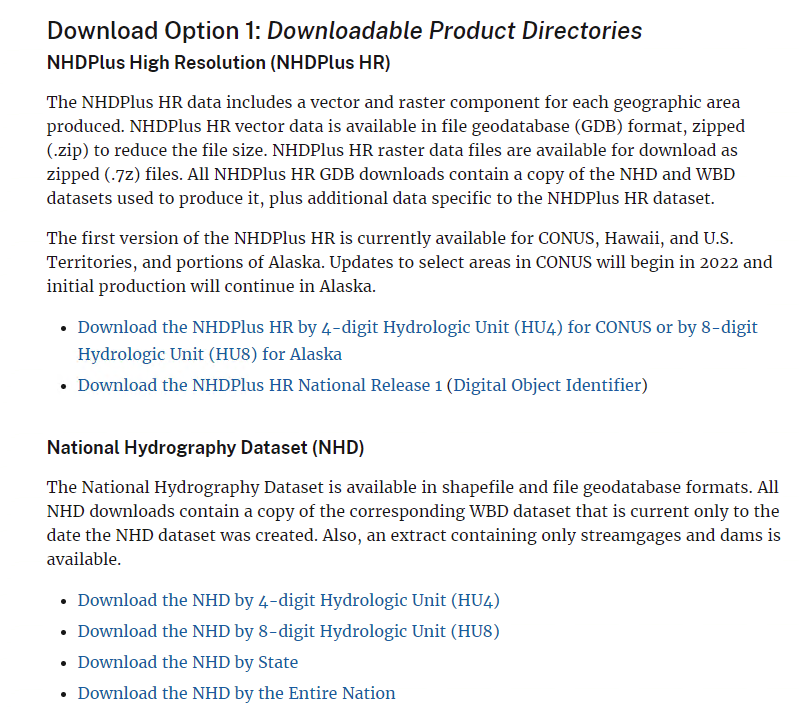
Image description: The image is a screenshot of a webpage detailing download options for hydrological data products. It is divided into two main sections: “NHDPlus High Resolution (NHDPlus HR)” and “National Hydrography Dataset (NHD).” Both sections include textual information about the data products and downloadable links.
- The first section, “NHDPlus High Resolution (NHDPlus HR),” provides a description of the NHDPlus HR data, including the formats available for download (vector and raster), geographic availability, and updates. It includes two bullet points with hyperlinks for downloading the data by different hydrologic units.
- The second section, “National Hydrography Dataset (NHD),” describes the NHD and the formats available. It mentions that the downloads include copies of the corresponding WBD dataset and an extract containing streamgages and dams. This section also features four bullet points with hyperlinks for downloading the NHD by various units and areas.Text in image:
Download Option 1: Downloadable Product Directories
NHDPlus High Resolution (NHDPlus HR)
The NHDPlus HR data includes a vector and raster component for each geographic area produced. NHDPlus HR vector data is available in file geodatabase (GDB) format, zipped (.zip) to reduce the file size. NHDPlus HR raster data files are available for download as zipped (.7z) files. All NHDPlus HR GDB downloads contain a copy of the NHD and WBD datasets used to produce it, plus additional data specific to the NHDPlus HR dataset.
The first version of the NHDPlus HR is currently available for CONUS, Hawaii, and U.S. Territories, and portions of Alaska. Updates to select areas in CONUS will begin in 2022 and initial production will continue in Alaska.
- Download the NHDPlus HR by 4-digit Hydrologic Unit (HU4) for CONUS or by 8-digit Hydrologic Unit (HU8) for Alaska
- Download the NHDPlus HR National Release 1 (Digital Object Identifier)
National Hydrography Dataset (NHD)
The National Hydrography Dataset is available in shapefile and file geodatabase formats. All NHD downloads contain a copy of the corresponding WBD dataset that is current only to the date the NHD dataset was created. Also, an extract containing only streamgages and dams is available.
- Download the NHD by 4-digit Hydrologic Unit (HU4)
- Download the NHD by 8-digit Hydrologic Unit (HU8)
- Download the NHD by State
- Download the NHD by the Entire Nation
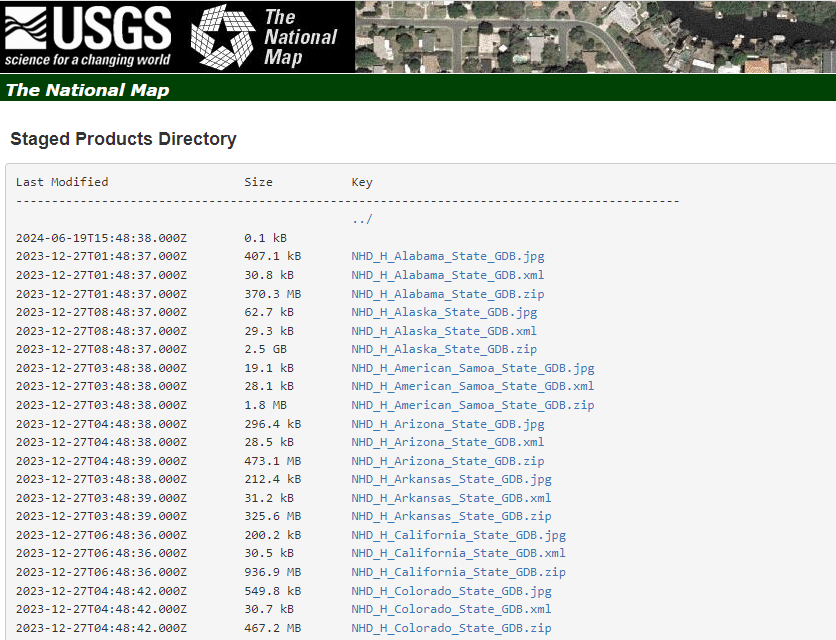
Image description: The image is a screenshot of a webpage from the “Staged Products Directory” of the USGS (United States Geological Survey) website. At the top, there is a header with the USGS logo and the text “science for a changing world” accompanied by “The National Map” logo and name. Below the header is a section labeled “The National Map” with a thin green bar underneath.
The main content is a directory listing table. The table contains columns labeled “Last Modified,” “Size,” and “Key,” indicating the date and time the entries were last modified, their file sizes, and their respective filenames or links. The first entry in the table is the parent directory (“../”), followed by various files related to different states and territories, including Alabama, Alaska, American Samoa, Arizona, Arkansas, California, and Colorado. Each state/territory has multiple entries with different file formats such as .jpg, .xml, and .zip, and varying file sizes.
After you download the geodatabase pertaining to your state of interest, move the data to your “hydrology” subfolder and unzip the file.
3. Creating a new project
Open up ArcGIS Pro and if necessary, enter your credentials to have access to the program. Under New Project, click on Map and name your project “Lab1.” You can keep the location in the Projects folder or save it to a readily accessible folder of your choice. In the ArcGIS Pro Catalog, connect to the folder with your “cityname_data” file. You should be able to see all the downloaded folders if you unzipped the folders.
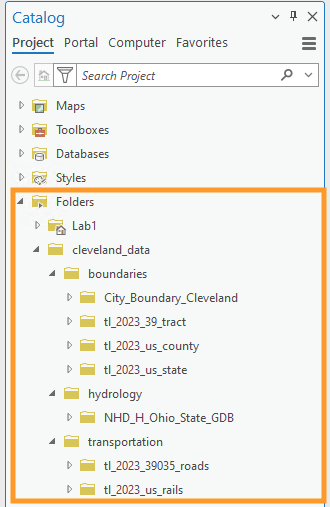
Image description: ArcGIS Pro Catalog panel which consists of a vertically arranged tree directory in a pane. At the top of the pane, there is a header with the title “Catalog” followed by four tabs labeled “Project,” “Portal,” “Computer,” and “Favorites.” Icons for folder options and view settings appear adjacent to these tabs.
Beneath the header, there is a search bar labeled “Search Project,” with icon buttons for executing the search and filtering, respectively. Following the search bar is an expandable tree structure containing several folders and items. The primary structure is labeled “Folders,” containing a subset named “Lab1.” Within “Lab1,” another subset named “cleveland_data” is fully expanded, revealing folders titled “boundaries,” “hydrology,” and “transportation.”
- Inside “boundaries,” there are folders for “City_Boundary_Cleveland,” “tl_2023_39_tract,” “tl_2023_us_county,” and “tl_2023_us_state.”
- Inside “hydrology,” there is one folder named “NHD_H_Ohio_State_GDB.”
- Inside “transportation,” there are folders titled “tl_2023_39035_roads” and “tl_2023_us_rails.”
The Folders section is outlined with an orange border, highlighting the contents.
4. Data Preparation
Geodatabase creation
As mentioned previously, you will need to create a geodatabase and feature datasets that are similar to your folder and subfolder naming structure. In this example, I created a geodatabase for Cleveland along with feature datasets for boundaries, hydrology and transportation. Make sure that you assign an appropriate projection to your feature datasets. In this case, I applied the NAD 1983 (2011) State Plane Ohio North FIPS projection to the feature datasets. Import the shapefiles you downloaded in the appropriate feature dataset and give them a meaningful name. The hydrology dataset is already in a geodatabase. You will only need to add the NHDWaterbody and NHDFlowLine features (located in the Hydrography feature dataset) to your hydrology feature dataset. For some datasets (i.e. the rails shapefile), will need to perform either a Select by Attribute or Select by Location query to narrow down your datasets to your city and state of interest and then export your data into the appropriate feature dataset in your geodatabase. Once you are finished with the data preparation, your geodatabase should look similar to below.
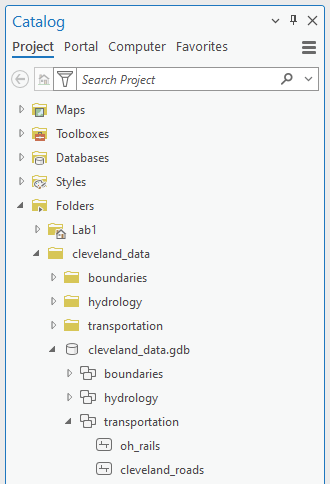
Image description: ArcGIS Pro Catalog panel interface which is organized in a hierarchical, collapsible tree structure with several nested folders and items. The catylog is divided into the following main sections (visible as tabs at the top): Project, Portal, Computer, and Favorites. The “Project” tab is currently active.
The catalog tree begins with top-level folders labeled “Maps,” “Toolboxes,” “Databases,” “Styles,” and “Folders.” The “Folders” section is expanded to show a sub-folder named “Lab1,” which contains another folder named “cleveland_data.” Within “cleveland_data,” there are three folders: “boundaries,” “hydrology,” and “transportation.” Additionally, “cleveland_data.gdb” (presumably a geodatabase file) is listed with its own nested folders: “boundaries,” “hydrology,” and “transportation.” Inside “transportation,” there are two items: “oh_rails” and “cleveland_roads.”
At the top of the catalog, there is a search bar labeled “Search Project.”
Categorizing data
You are going to need to add symbology to the roads, waterbody, and flowline feature classes by category so you can do Lab 2. For the roads feature class, you will need to add symbology by MTFCC code. Please refer to the 2022 MAF/TIGER Feature class codes document when adding symbology to the roads feature classes to rename the labels. For the NHD dataset, refer to the National Hydrography Dataset (NHD) Data Dictionary Feature Classes document when adding symbology to the flowline and waterbody feature classes. Add whatever symbology you think is appropriate for the time being.
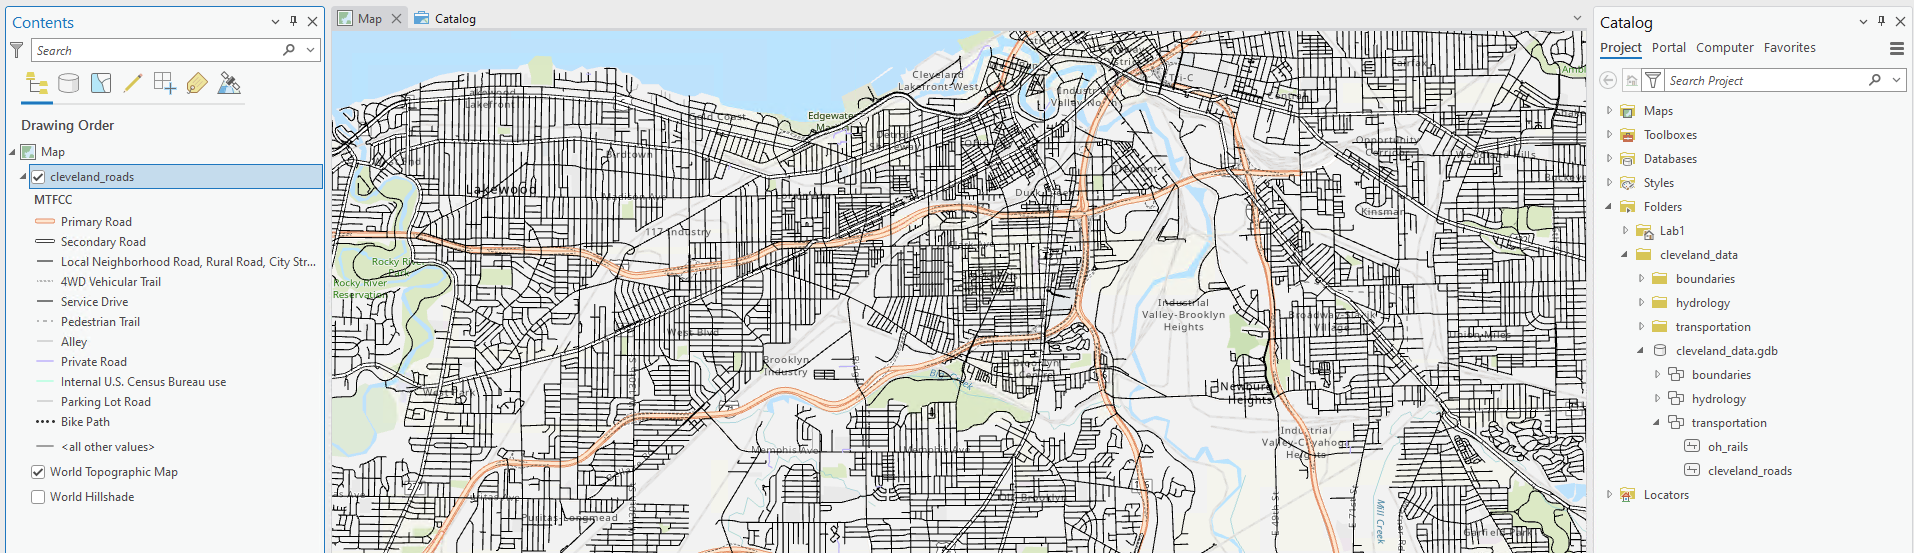
Image description: ArcGIS Pro map layout interface with a detailed street map of Cleveland, Ohio. The interface features several panes and toolbars housing various functionalities and layers.
General overview:
- Contents Panel (Left): This area contains the “Contents” pane, showing the drawing order and a checklist of map layers, including “cleveland_roads,” “World Topographic Map,” and “World Hillshade.” Below these are color-coded line types for various types of roads like primary roads, secondary roads, and bike paths.
- Map Display (Center): The primary view displays a map with various road types and geographic features, including primary roads marked in orange, secondary roads in black, and additional paths like bike paths represented with purple lines. Water bodies and green spaces are also visible on the map.
- Catalog Panel (Right): This side contains the “Catalog” pane, displaying a folder structure for project files, including maps, toolboxes, databases, styles, and specific folders under “Lab1” pertaining to Cleveland data. Subfolders under Cleveland data cover boundaries, hydrology, and transportation.
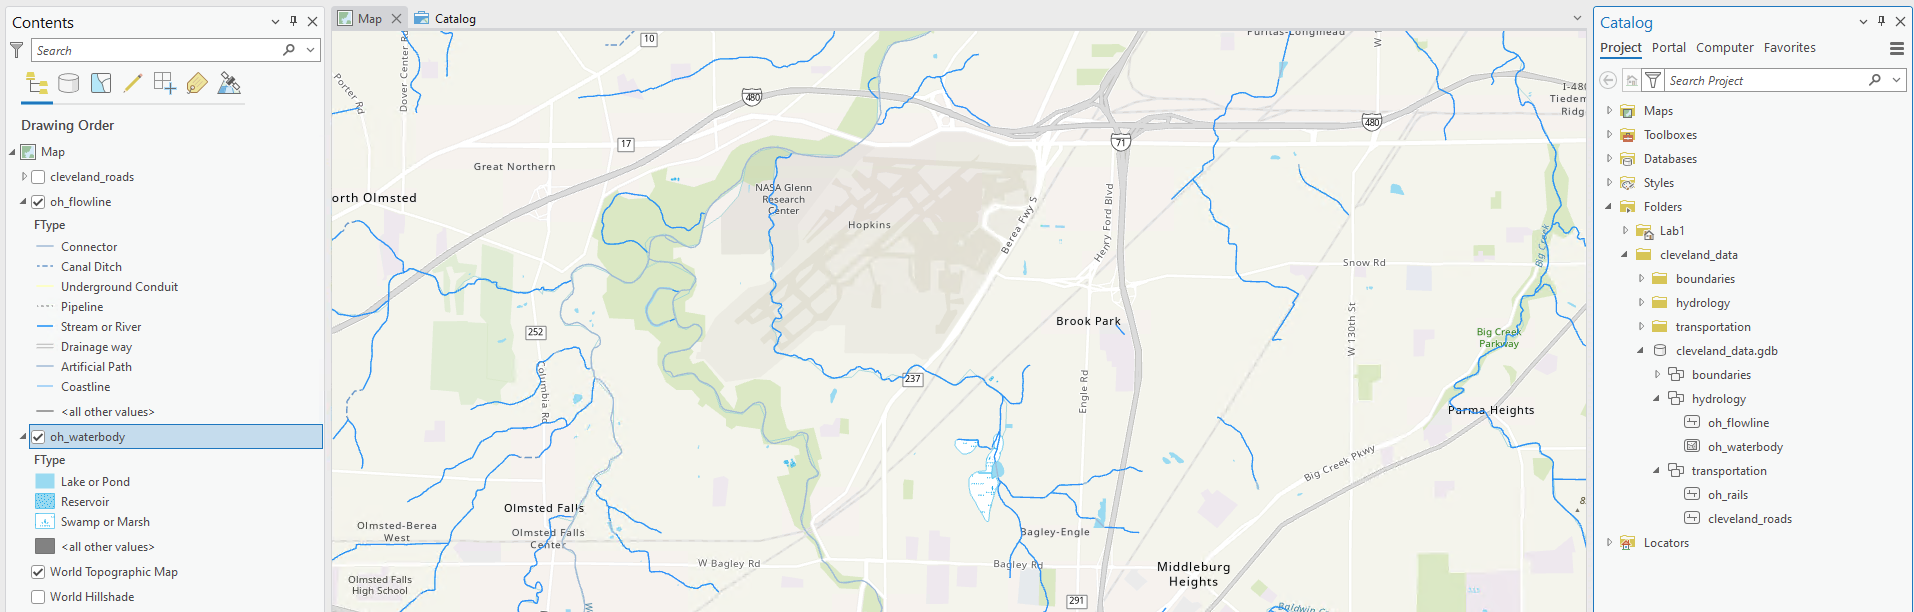
Image description: ArcGIS Pro interface which divided into three main sections: the “Contents” panel on the left, the “Map” display in the center, and the “Catalog” panel on the right.
General Overview:
- Contents Panel (Left): Displays layers and the drawing order for the map. It includes a hierarchical list of GIS data layers such as “clevland_roads”, “oh_flowline”, and “oh_waterbody”. Each layer expands to show subcategories such as “Stream or River,” “Connector,” “Artificial Path,” and various other geographic features represented on the map.
- Map Display (Center): Shows a detailed map featuring geographic information around the region of North Olmsted, with notable points like NASA Glenn Research Center, Hopkins, Parma Heights, and other localities. Various water bodies, streams, and roads are marked.
- Catalog Panel (Right): Lists the project folders and contents, including maps, toolboxes, databases, and styles.
Now that you have done all the data preparation, you are now ready to do Lab 2! It is worth repeating that you will have to change your symbology for both Lab 2 and 3 but working with map symbology in this lab gave you a little more familiarity with the Symbology feature in ArcGIS Pro along with giving you experience with using U.S. Geological Survey (USGS) and U.S. Census Bureau documentation to aid you with the symbolization of the feature classes. You will get more detailed guidance regarding symbology in the Lab 2 Visual Guide.
