
Multivariate Choropleths
Multivariate Choropleths
As choropleth maps are the most popular type of univariate thematic map, it is not surprising that they are also commonly used in multivariate mapping. Most common are bivariate choropleths—choropleth maps that visualize two variables. Note that while cartographers have historically described maps of two data variables as bivariate, these maps can also be described as multivariate (more than one variable). In the context of this lesson and course, we will generally use the more comprehensive description multivariate maps.
The map in Figure 5.2.1 is an example of a bivariate choropleth distributed by the U.S. Census Bureau. It uses a hue progression (yellow to blue) to visually encode population density, and color lightness to visually encode population change. The way these symbols are combined is explained by the 3×3 box legend in the lower right.
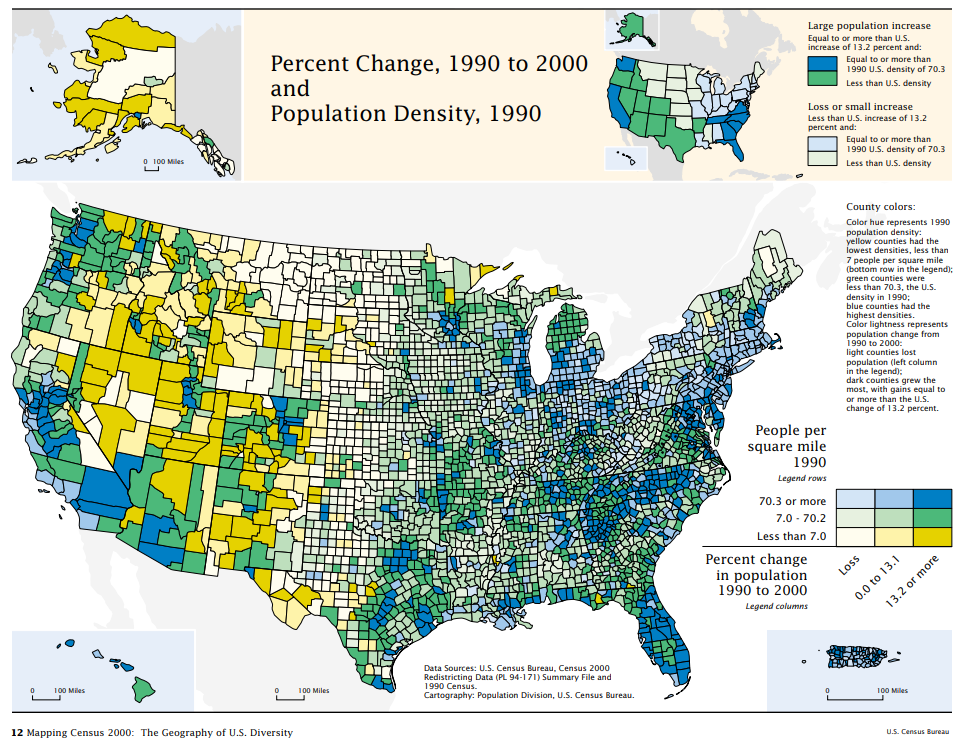
You might notice that this map uses color hue to encode population density, which is a sequential quantitative variable—a design choice we have discouraged in previous lessons. In general, color lightness is a much better choice for encoding quantitative data. In this map, however, color lightness is already being used to map the other variable—population change. Creating multivariate maps sometimes requires bending the rules of cartographic conventions a bit so as to best represent all of your data.
