
Multivariate Maps
Multivariate Maps
So far in this course, we have discussed many different ways of symbolizing data using visual variables. Our focus has been primarily on univariate maps—maps that show only one thematic data attribute.
This is a good start, but cartographers often wish to map more than one variable in a thematic map. This is called multivariate mapping. When creating multivariate maps, you should think about the best way to map each individual variable, as well as how you can best combine them to suit your maps audience, medium, and purpose.
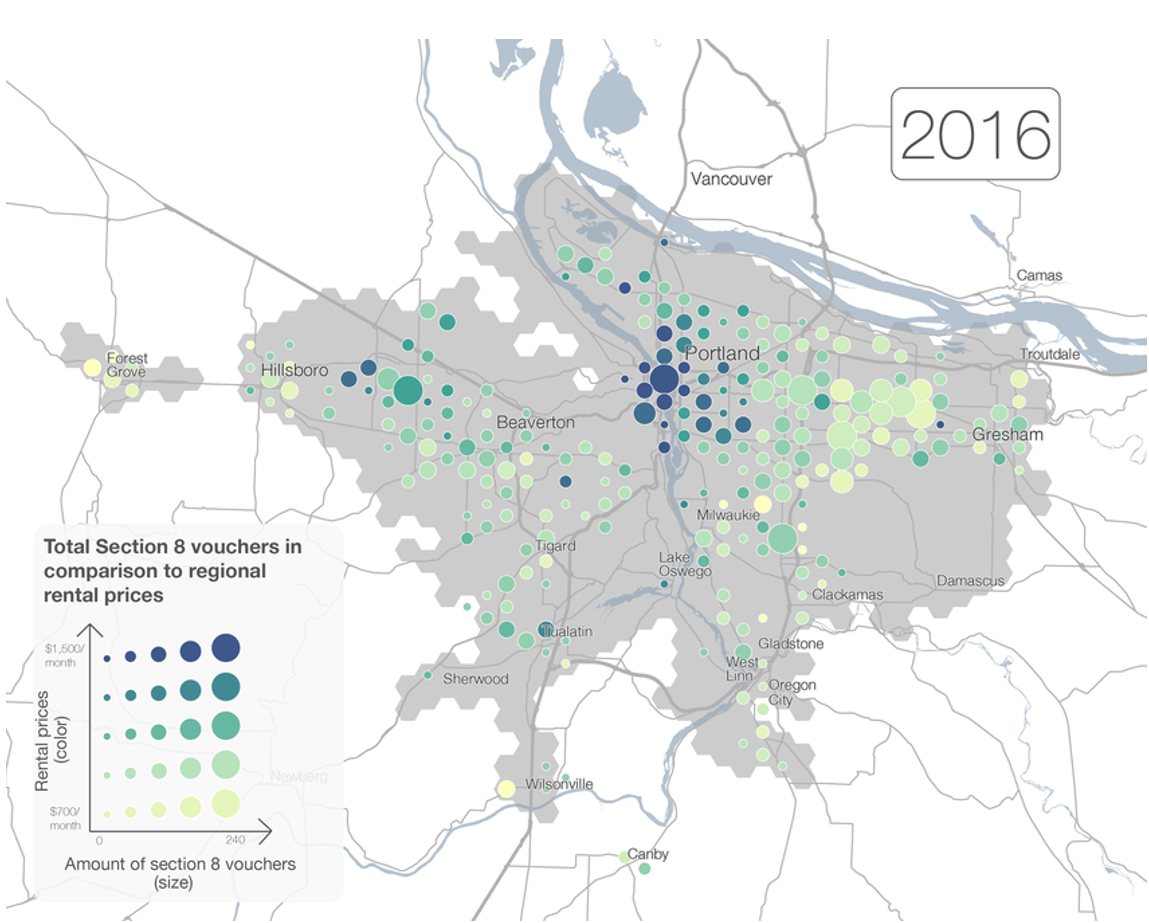
The map in Figure 5.1.1 is a multivariate map. The map visualizes two variables at each location—rent prices, and the number of Section 8 vouchers. These variables are each mapped appropriately individually: first, rental prices are visually encoded with a sequential color scheme, a good symbolization choice for normalized data such as rates. The number of Section 8 vouchers at each location is mapped with size, an appropriate visual variable for mapping count data. Together, these symbols work together to visualize this housing data from Portland.
Note that the legend in Figure 5.1.1 is more complicated than many of the legends that we’ve seen so far. The format shown—one variable along the x-axis, and one along the y-axis, is common in bivariate maps, or maps that display two data variables. It not only explains how to data is encoded, but helps the map reader to understand how the data are related to each other. The more complicated a map becomes, the more challenging it will be to design a useful legend. Legend design is an important task however, as your legend is key for proper reader interpretation of your map. The map in Figure 5.1.2 below uses short text blurbs to assist the reader in this interpretation.
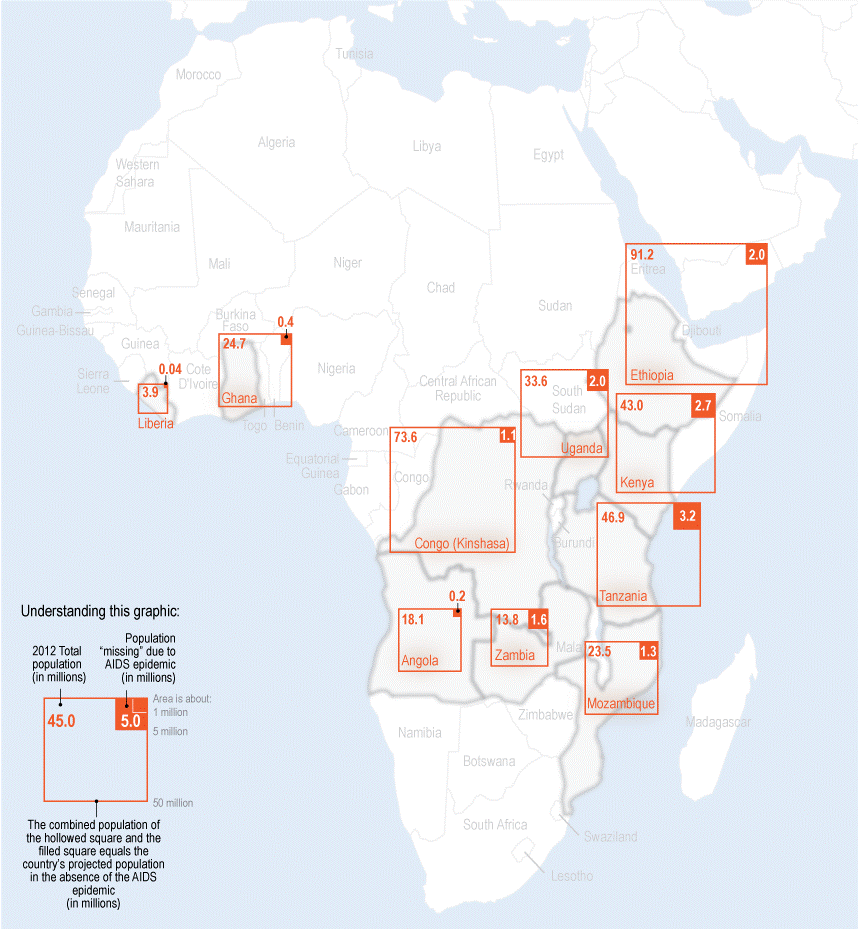
As we continue through this lesson, keep an eye on the legends used in various maps. Some maps, such as bivariate choropleth maps, have somewhat standard legend designs. Others, such as the one used in Figure 5.1.2, are somewhat less so; they are designed and customized by the cartographer to suit the map’s data and purpose. Legend design is an important component of cartographic design in general, but is particularly important for multivariate maps.
Student Reflection
Consider the legends you have made for your maps in the labs thus far. For which map did you find designing the most challenging? Why?
