
Uncertainty and Decision-Making
Uncertainty and Decision-Making
In the last section, we discussed how to conceptualize uncertainty, and ways in which it can be visualized. One important question remains: why should we do so? Creating well-designed maps can be challenging, and adding a depiction of uncertainty makes this process even more so.
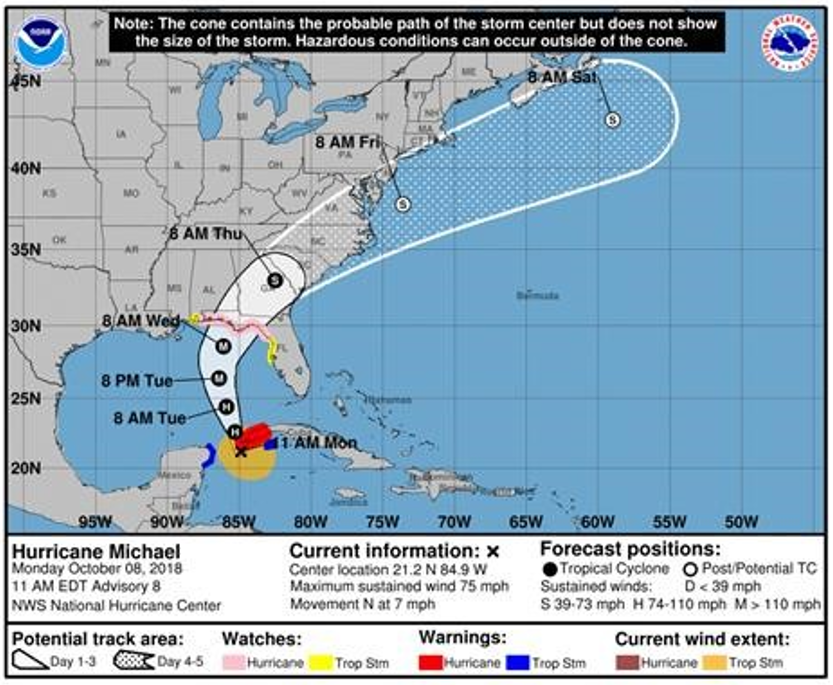
Uncertainty is typically depicted in maps for two primary reasons: (1) its inclusion may be regarded as an ethical necessity—many maps are created with significantly uncertain data, and a cartographer might feel that withholding this information from the map reader would be misleading. (2) Consideration of uncertainty plays an important role in decision-making, and thus its visualization might be necessary in some contexts—for example, maps of predictive hurricane paths tend to include a “cone of uncertainty” (Figure 7.9.1)—and such maps often play an important role in decisions made by residents of storm-affected areas.
So how does the visualization of uncertainty effect decision-making with maps? Kinkeldey et al. (2015) conducted a review of studies that attempted to answer this question. Most of the studies they analyzed suggested that the visualization of uncertainty does have an effect on task performance with maps and similar spatial displays (Kinkeldey et al. 2015). Simpson et al. (2006), for example, studied the use of uncertainty visualization in surgical tasks with graphic displays, and noted that the inclusion of uncertainty visualization improved performance accuracy. The positive influence of uncertainty visualization on task-completion accuracy with maps is a somewhat common finding. Though findings are less consistent with regards to task completion times (i.e., speed), uncertainty visualization seems at least not to significantly increase task-completion times (Kinkeldey et al. 2015).
Despite this, there is still not a consensus concerning whether uncertainty visualization is always helpful for decision-makers—some studies note that participants perceive uncertain data as risky, which can induce irrational decision-making via loss-aversion (Hope and Hunter 2007). Whether uncertainty visualization is useful—and whether it is useful enough to warrant the design efforts it requires—is context dependent and still thoroughly up for debate.
