Visual Encoding: Examples for Reflection

Student Reflection
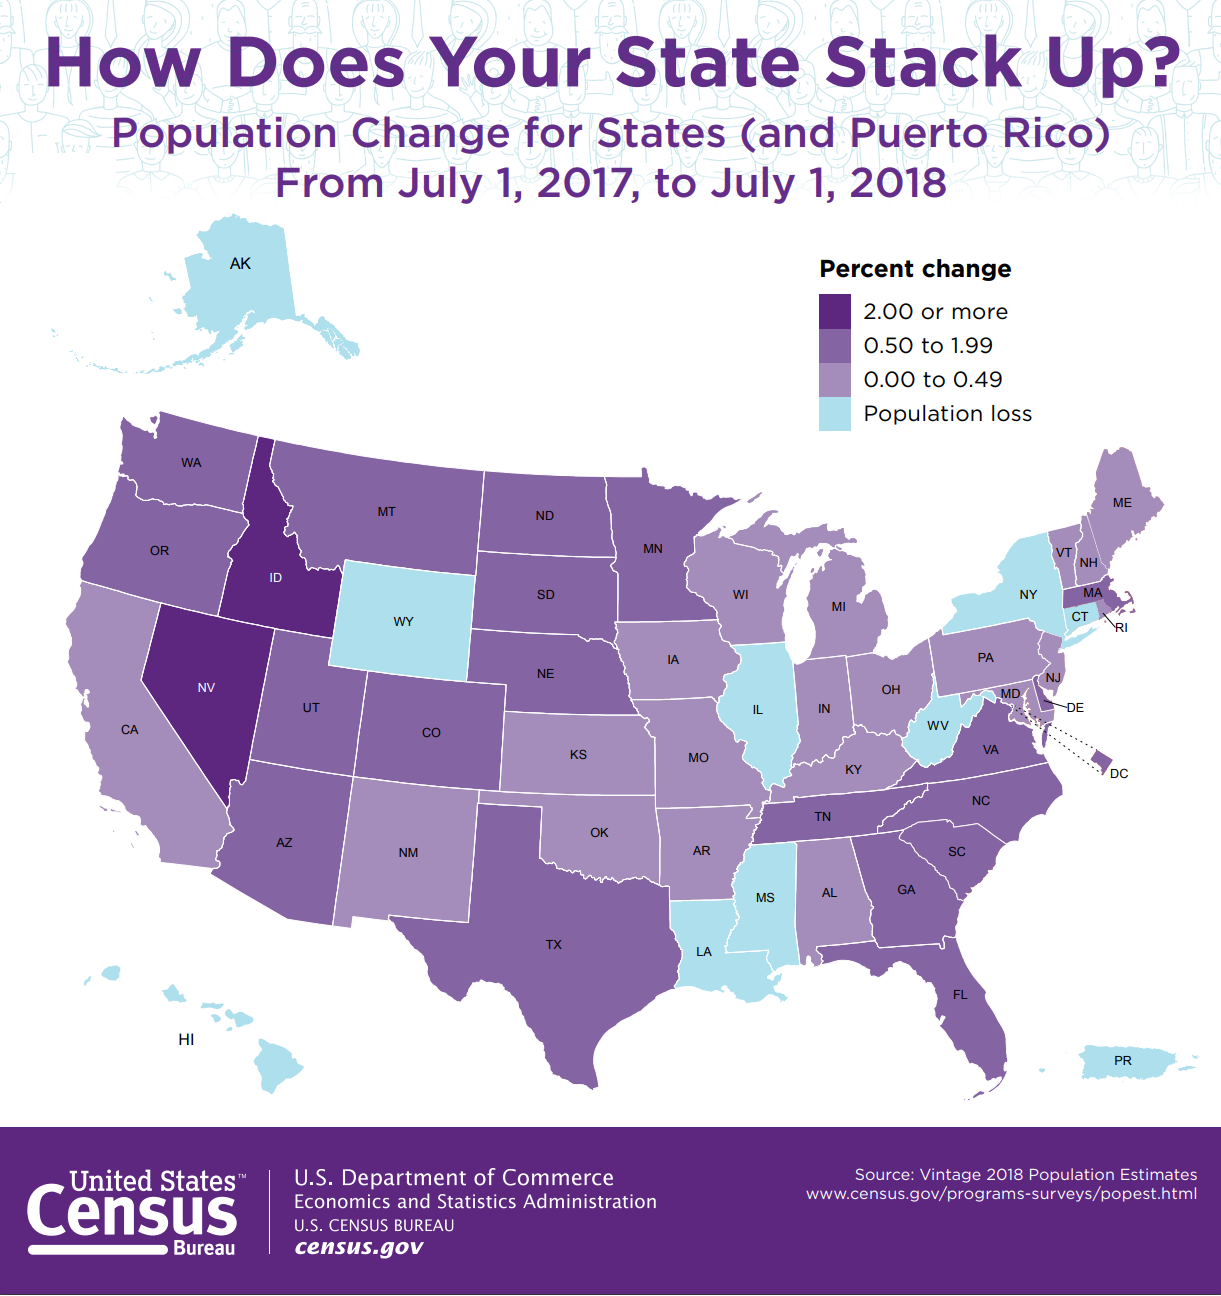
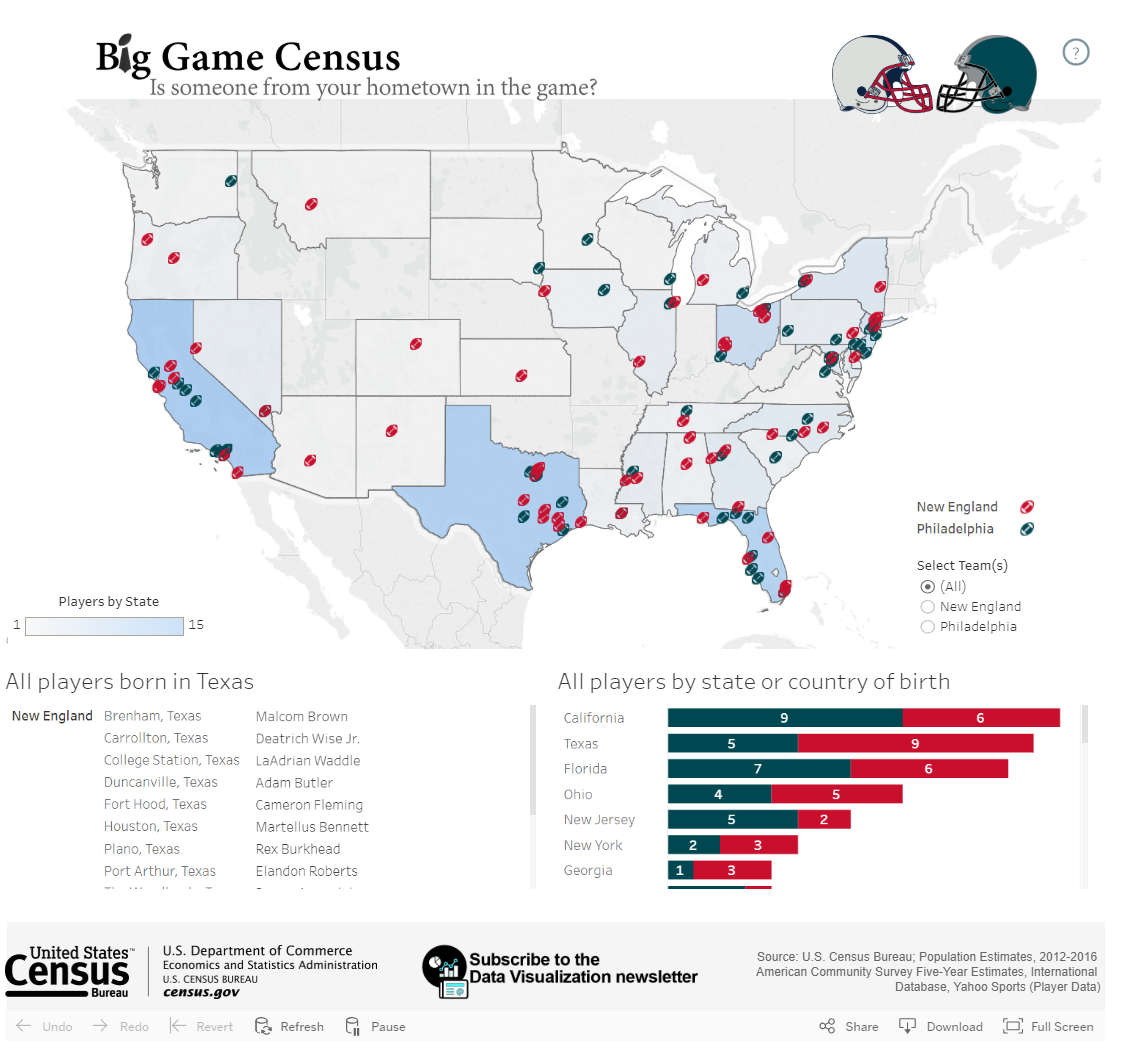
Analyze the maps shown below. For each map, identify the level of measurement of the data mapped. What visual variables are used to encode this data? Is the map effective—does it tell you what you need to know?
Figure 3.6.1 Example Map #1 Credit: Census.gov
Figure 3.6.2 Example Map #2 Credit: usda.gov (click link for a larger image!)
Figure 3.6.3 Example Map #3 Credit: Census.gov (click link for an interactive graphic!)

License

Icon for the Creative Commons Attribution-NonCommercial-ShareAlike 4.0 International License

Digital Cartography Copyright © 2024 by Dorris Scott is licensed under a Creative Commons Attribution-NonCommercial-ShareAlike 4.0 International License, except where otherwise noted.

Share This Book