
Chapter 9: Collecting and Cleaning the Data
Getting the Data
Data are provided for the purpose of these exercises, but in this section, we will walk through what data we need and how to find it.
Data we will collect includes:
- Income (source: US Census)
- Housing characteristics (source: US Census)
- Demographics (source: US Census)
- Housing assessments (source: St. Louis County Open Data)
- Zoning information (source: St. Louis County Open Data)
- Schools (source: MSDIS)
- Floodways (source: St. Louis County Open Data)
- Sinkholes (source: MSDIS)
- Voting results (source: St. Louis County Elections)
- Bakeries (source: Data Axel)
Getting Census Data
The Census provides two types of data we need, geospatial and tabular. The exercises in this book will use Census Tract Level Data for St. Louis County.
Getting Census Tract Tigerline Files
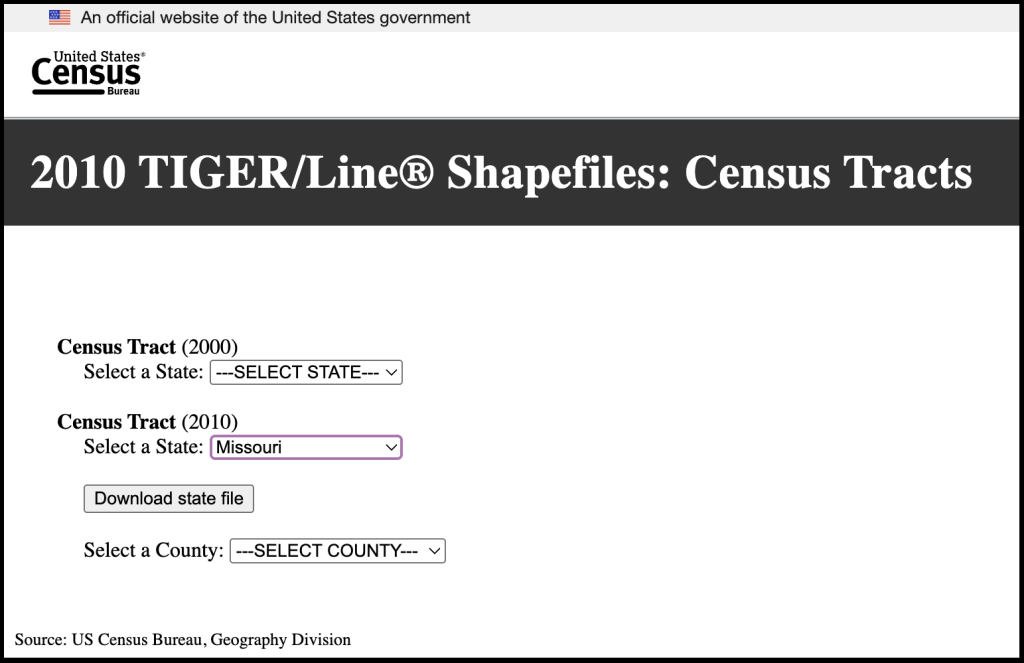
Go to the Census TIGER/Line Shapefiles page.
- Select year: 2010
- Select layer type: Census Tract
- Submit
- State: Missouri
- County: St. Louis County
- Download
The Census tables can be retrieved from the Census’s Data and Maps Page. Census.gov provides the Decennial Census (10yr) as well as the American Community Survey (estimates between the decennial census).
If you are unable to get historical data from the Census site, another useful tool is IPUMS NHGIS.
Using the advanced search in Census.gov, filter for the following.
1. Go to the Explore Census Data page and do a separate Advanced Searches for tables for housing, income, and race.
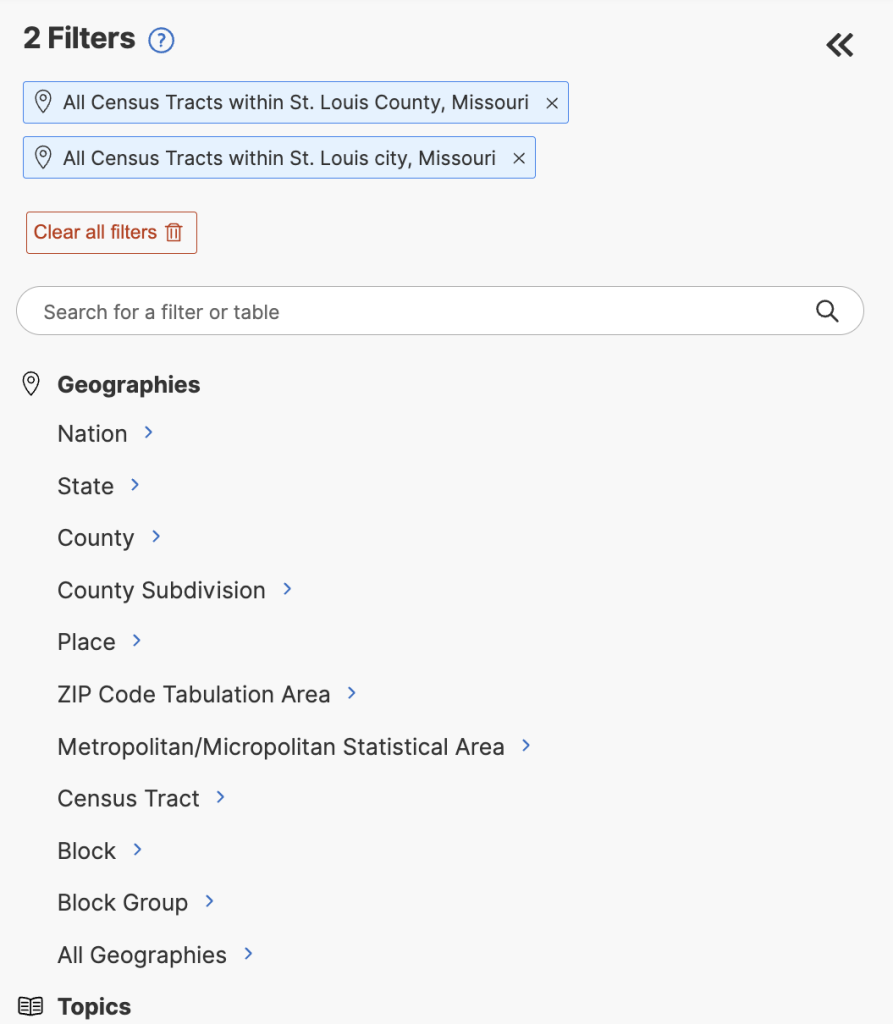
Geographies
- Census Tracts
- Missouri
- St. Louis County
- All Census Tracts in St. Louis County Missouri
- St. Louis County
- Missouri
I recommend gathering these topic tables separately.
Topics
- Housing
- Download 2010 table DPO2 (zip file)
- Remove topic filters, keep geography filters
Topics
- Income and Poverty
- Download 2010 table S1901 (zip file)
- Remove topic filters, keep geography filters
Topics
- Race
- Download 2010 table B02001 (zip file)
2. Getting Floodways
These are made available through St. Louis County Open Data Portal.
Search: flood
- Select Flood Hazard Areas, 1% Annual Chance
- Select FEMA Floodways
- Download shapefile dataset
3. Getting Sinkhole Data and School Locations
MSDIS stands for Missouri Spatial Data Information Service, and it houses a variety of data sources for the state.
You can find schools by searching for schools.
- Download the .shp file
You can find sinkholes by searching for sinkholes
- Download the 2018 sinkholes .shp file.
4. Datasets can be found here.
Cleaning Data
![]() Software for cleaning data:
Software for cleaning data:
First go to Open Refine and download software specific to your operating system (e.g. OpenRefine 3.9.3 for MacOS)
The cleaning we will need to do is on the Census tables. Our tables require a few basic actions:
- Prepare the data so it will successfully join.
- Ensure numerical columns will be read as numbers.
- Remove any unnecessary information.
- Document our changes
You will remember from earlier chapters that we can join tabular data to geospatial data. However, we can only accomplish this if we have a field that meets all the criteria for joining.
Requirements for a successful join
- Join fields must contain matching values (a unique identifier is an ideal value for joining)
- Join fields must be the same data format (e.g., string, integer, etc.)
- Field headers must not contain spaces or special characters
- Field values are clean and standardized
- Field headers should not use reserved words (e.g., date,” “day,” “month,” “table,” “text,” “user,” “when,” “where,” “year,” or “zone”)
- Table is in an incompatible format
Identifier values match:
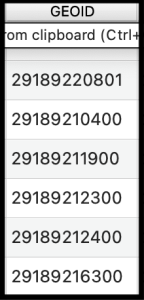
Our project will require us to join our Census tables to our Tigerline Files. The Census uses a field called Geoid to accomplish this.
A Tigerline GeoID looks like this: 29510127600; the id breaks down like this:
- 29 is the Census ID for the State of Missouri
- 510 is the County Number (in this case it represents the county of St. Louis City)
- 127600 is the Tract number
- On their own, none of these numbers are unique, but when amalgamated, it can be unique.
Census tables GeoID’s often look like this when downloaded: 1400000US29510127600
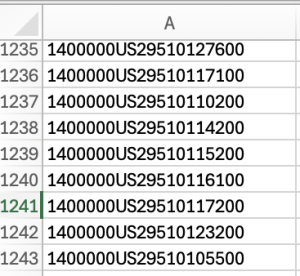
1400000US in a national code. The rest of the id is the same as the id in the Tigerline file
Steps to clean the data:
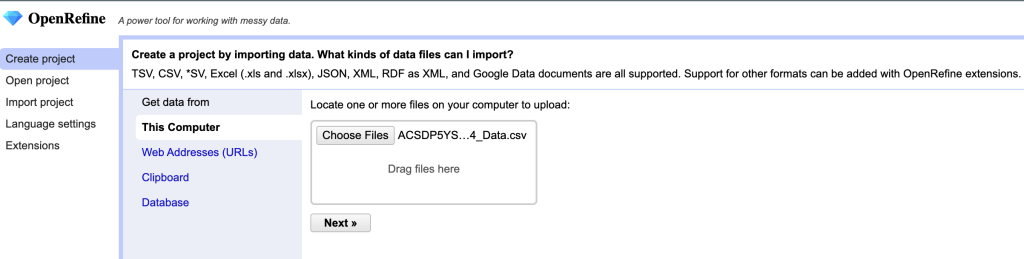
- Launch OpenRefine
- Create Project
- Upload, navigate to one of the downloaded Census tables
- Next
When prompted to parse the data you will be asked:
- Columns are Separated By: the column separation method, which is based on the type of file you are working with our data is in CSV format (comma separated values), so our separation method is a comma.
- Use Character: because sometimes your data will contain the character used for separation, we need to tell OpenRefine how to know when it’s serving its separation function and when it’s part of the value. We will accept the default (“).
- Trim leading and trailing white space from string. Spaces are hard to clean out of a dataset because you can’t really see them with your eyes when they’re at the end of a value, but they can cause big problems for analyses. Open refine can remove the white when this is selected. We will select this box.
- Ignore first line: we want our first line treated as a header, so do not choose this option.
- Parse next: If our dataset has multiple headers we can tell OpenRefine how many lines are reserved as headers. In our case we will choose one.
- Column names: if you have ignored the first line and want to provide column names you can list them here, for our purposes we will use the provided column names in the dataset, so we will not fill out this field.
- Discard initial rows of data: this can be helpful if there are rows of information preceding the dataset. For our purposes we will not use this.
- Load at most: if you don’t want to load all the rows of the dataset you can indicate how many to load. For our purposes we will not be using this.
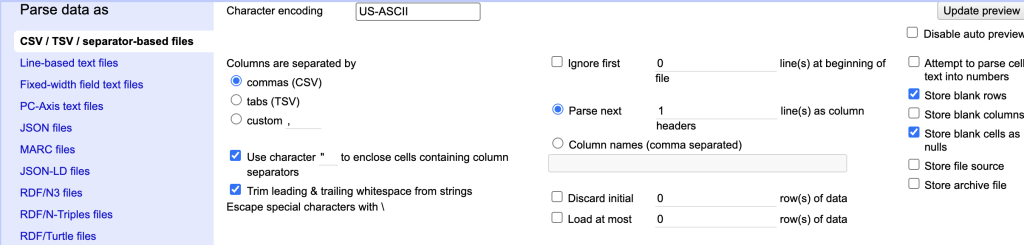
Screenshot of the OpenRefine parsing screen - Disable auto preview: If you don’t need to see the parsing, check this. We will not check this
- Attempt to parse all text into number: This can be useful if you know all the number character should. be text. In our case, we want our variable numbers to read as numbers, but our unique identifier, which is also numbers should read as a string, so we will not check this.
- Store blank rows: Unless there is a good reason, I would recommend removing blank rows because they will read as null value. We will deselect store blank rows.
Screenshot of the OpenRefine star row action - Store blank columns: Unless there is a good reason, I would recommend removing blank columns because they will read as null value. We will deselect store blank columns.
- Store file source: This would store in OpenRefine, which is not necessary, but you want to document your source.
- Store file archive: This would store in OpenRefine, which is not necessary, but you want to document your changes and keep a copy of the original file.
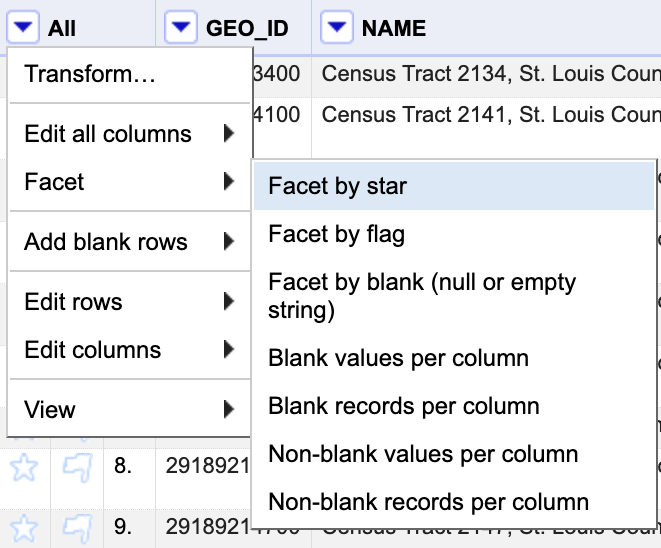
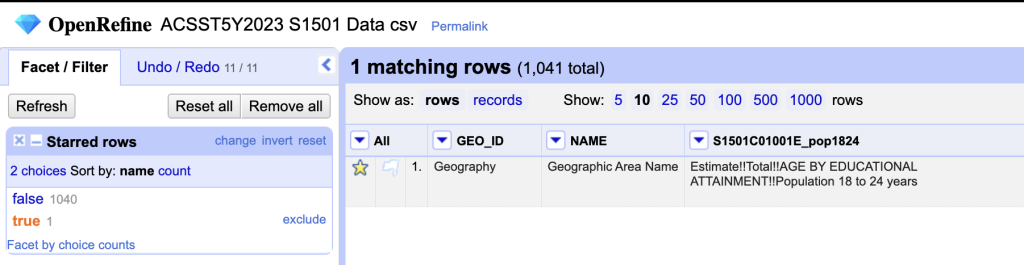
Remove Row 2
To clean up this data we need to remove row 2 so that we are working with number values only. To do this we will:
- Click the star symbol next to row two.
- Toggle down the “All” menu
- Choose “Facet by Star”
Screenshot of the OpenRefine create facet by star action - Select the values that are “true”
Split Column
Toggle down the “All”
- Go to edit rows
- Remove matching rows
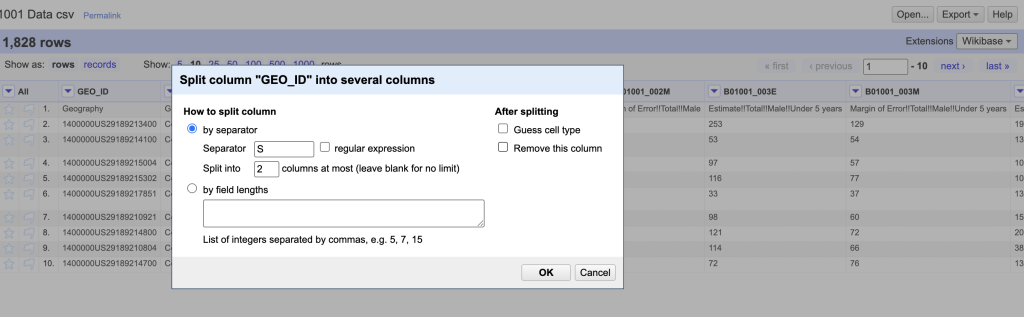
- Next step is to remove the extra numbers (1400000US) from the geoid.
- Toggle down in the geoid column, click “edit column”
Screenshot of the OpenRefine matching rows
Choose the option to “split into several columns”
- How to split the column: by separator. We have to tell it what the separator, in our case the separator will be “S” because that’s the last character in the string we want to remove.
- Split into 2 columns
- After splitting, “deselect guess cell type” be
Screenshot of the OpenRefine split columns dialog cause may guess number for our geoid and we want it to remain a string.
- “Deselect remove this column” because in case we need to redo it it’s good to have it available.
If it parsed successfully, there are now three columns: the original column “geoid”, geoid1 has the content we want to remove (1400000US), and geoid2 has the tract id that will match our geospatial data.
Remove un-needed columns
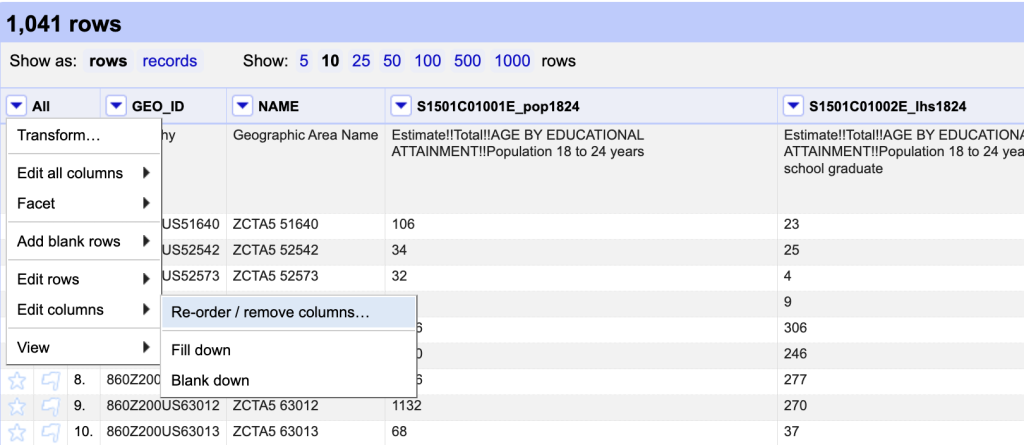
To remove one or two columns; you can toggle down to
- “Edit column”
- select “remove column”
To remove several columns, toggle down the All column, Edit columns, “re-order/remove columns.” All the columns will be listed in the left pane, and the right pane will be empty.
You can drag and drop columns 1 by 1 OR you can select remove all columns, and all the columns will move to the left pane, then drag the ones you want to keep back into the left pane.
Using the metadata table for each of our tables, you can identify which columns to keep.
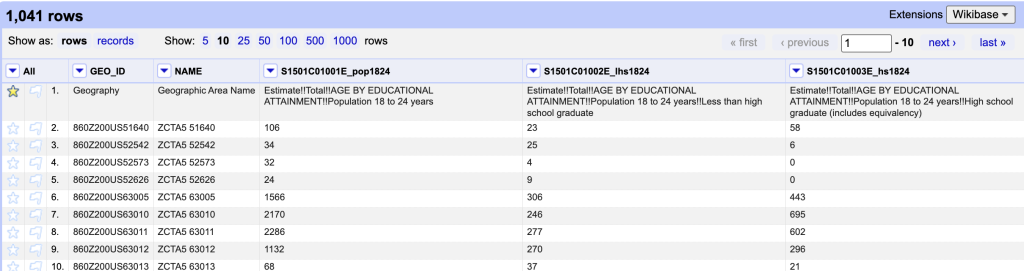
For the ACSST5Y2010_S1901, keep:
- GEO_ID_2
- S1901_C01_001E
- S1901_C02_001E
- S1901_C02_0012E
- S1901_C02_0013E
For the ACSDP5Y2010_DP04, keep
- GEO_ID_2
- DP04_0001E
- DP04_0045E
- DP04_0045PE
- DP04_0088E
- DP04_0088PE
For the ACSDT5Y2010_B02001, keep:
- B02001_001E
- B02001_002E
- B02001_003E
- B02001_004E
- B02001_005E
- B02001_006E
- B02001_007E
- B02001_008E
- B02001_009E
- B02001_0010E
Rename Columns
In each column, toggle down the column.
For the ACSST5Y2010_S1901, keep GEO_ID_2.
- S1901_C01_001E, change to totpop
- S1901_C02_001E, change to totfam
- S1901_C02_0012E, change to medfam
- S1901_C02_0013E, change to meanfam
For the ACSDP5Y2010_DP04, keep GEO_ID_2.
- DP04_0001E, change to totoccs
- DP04_0045E, change to estoo
- DP04_0045PE, change to prctoo
- DP04_0088E, change to medval
For the ACSDT5Y2010_B02001
- B02001_001E, change to totpop
- B02001_002E, change to ewa
- B02001_003E, change to eba
- B02001_004E, change to eaiana
- B02001_005E, change to eaa
- B02001_006E, change to enhopa
- B02001_007E, change to esora
- B02001_008E, change to e2mra
- B02001_009E, change to e2mior
- B02001_0010E, change to em2reor3mr
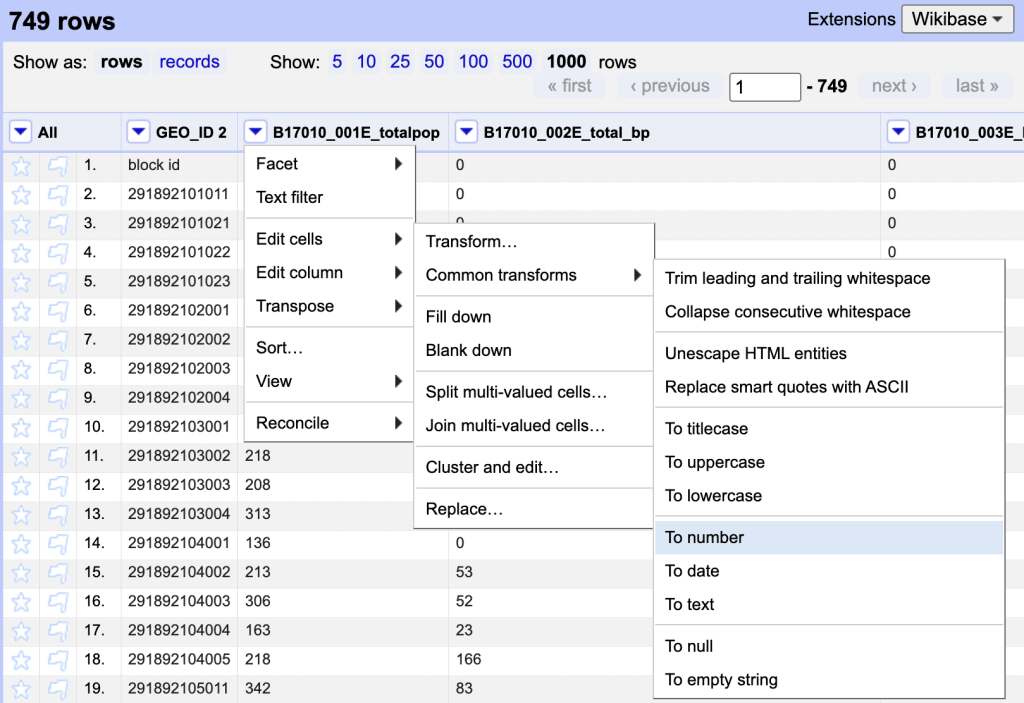
Convert strings to Numbers
The variable columns are reading as strings because before row 2 was removed, there was text in those columns. Because this is a popular transform another option is to go to “Common Transforms” and select “to number”.
After changing a few columns one-by-one, you might notice that there are A LOT of columns in this dataset. If you go to the “All” menu, choose “Transform”, “To Number”, you will get a checked list of columns. Deselect “Geoid” and “Name” and select ok.
The final step in this dataset is to export the dataset. You can do that using the export button in the upper-right corner, chose to “export to csv”. You will need to rename OpenRefine output as using the table number because QGIS will adopt the name of the table as a part of the variable name. For example rename:
- ACSST5Y2010_S1901 = S1901.csv
- ACSDP5Y2010_DP04 = DP04.csv
- ACSDT5Y2010_B02001 = B02001.csv
Make sure you clean and rename all the census tables.
