Chapter 13: Thematic / Choropleth Maps
Chapters 13- 16 will focus more on analyses than we have thus far by exploring some different way of quantifying and visualizing how much of something there is in a location. First, we will simply visualize quantities by separating them into bins, next we’ll use a tool called kernel density estimator to find areas of concentrated features, or hot spots. Fiwe will count the number of one feature that falls into another location.
- Graduated colors
- Kernel Density (chapter 14)
- Create a buffer (chapter 15)
- Points in polygons (chapter 15)
Step 1. Creating thematic maps by graduated symbology (choropleth): numbers represented by colors or symbols
We are going to symbolize by a value in our attribute table. As discussed in Chapter 7, we can tell a different story with our data based on how we break up the values. Anytime we want to express the magnitude of a phenomenon using classification, we make tradeoffs. It’s important to be transparent about those tradeoffs.
- Turn off the other layers except for innerring_tract_income
- Right click on the innerring_tract_income
- Go to Properties
- Click on symbology
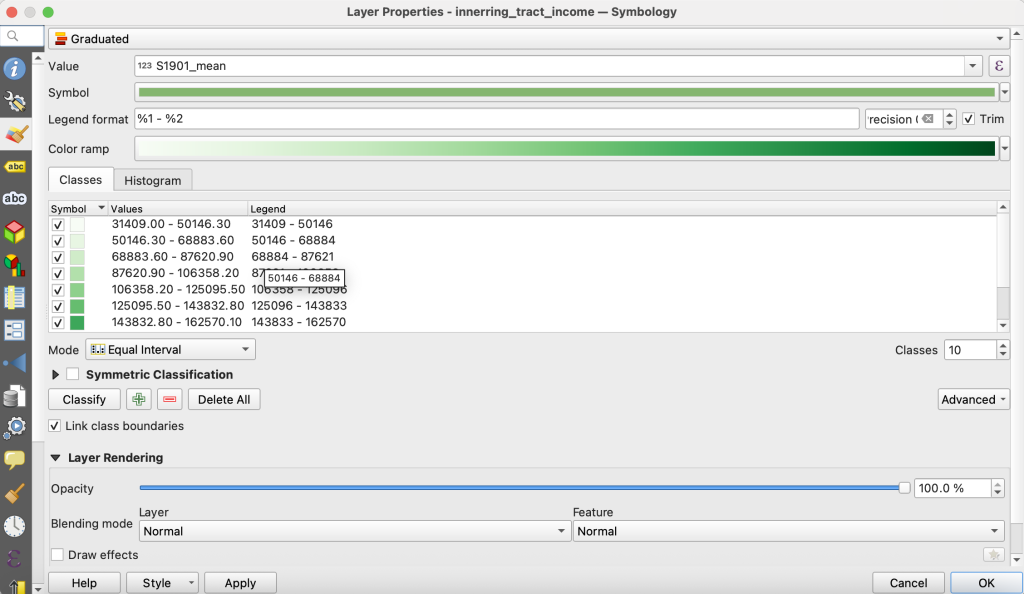
- From the dropdown menu, change from single symbol to graduated colors
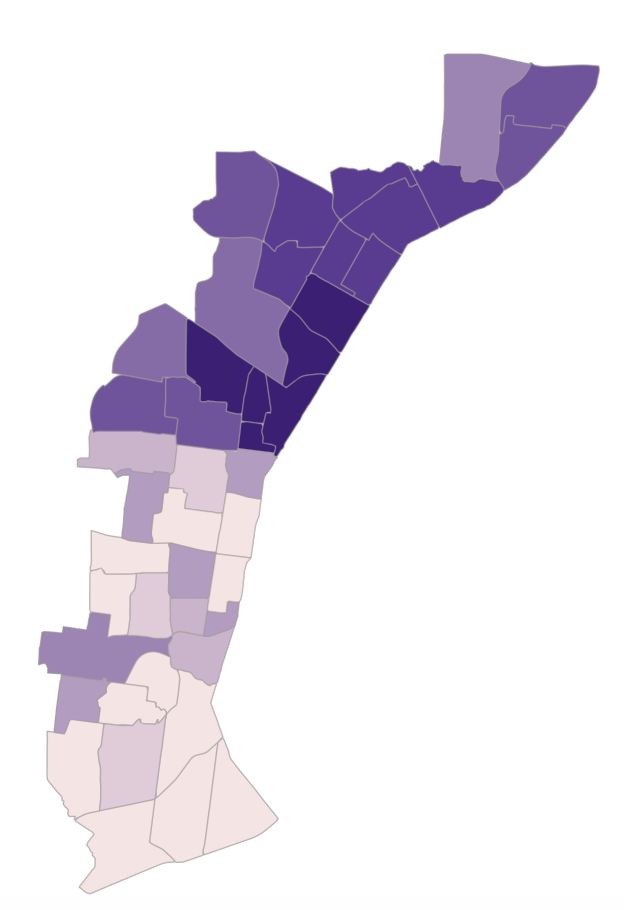
Screenshot of gradated mean income in QGIS - We want to symbolize the mean income for families for innerring_tract_income.
- Value: S1901_mean
- I used a green ramp to reflect income, but a neutral ramp would be fine too.
- Mode: equal interval
- Classes: 10
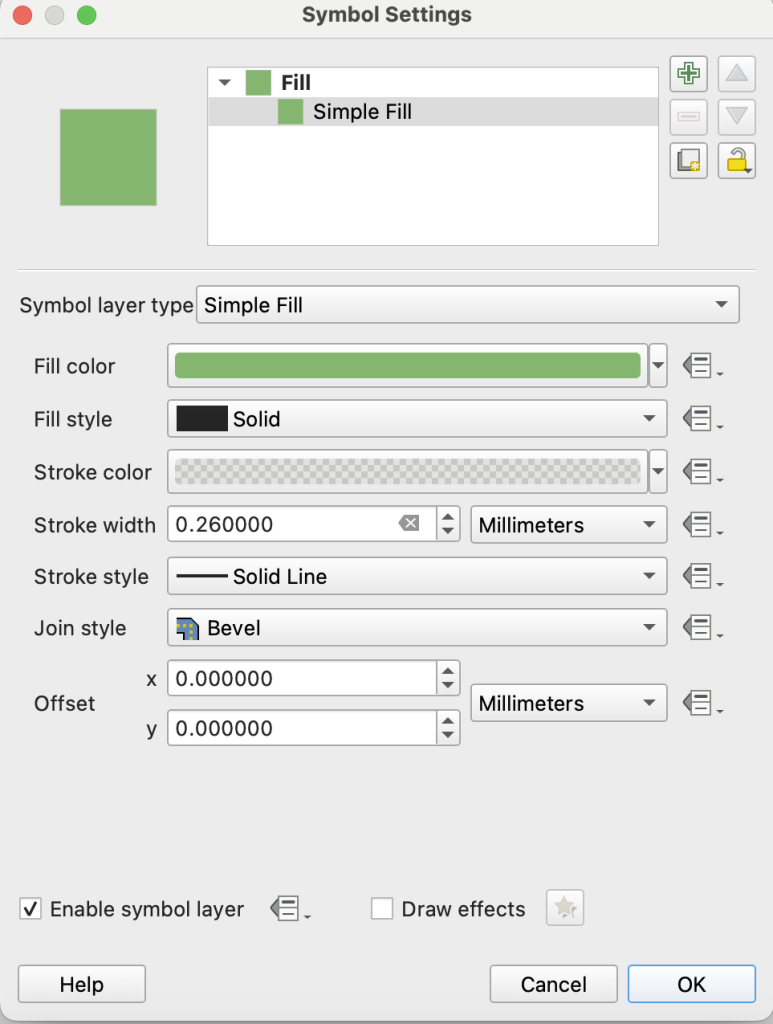
- To change the boarder color, drop down Symbol
- You don’t need to change the fill
- Change the stroke to light gray and make it 50% transparent
1b. Symbolize the other census layers
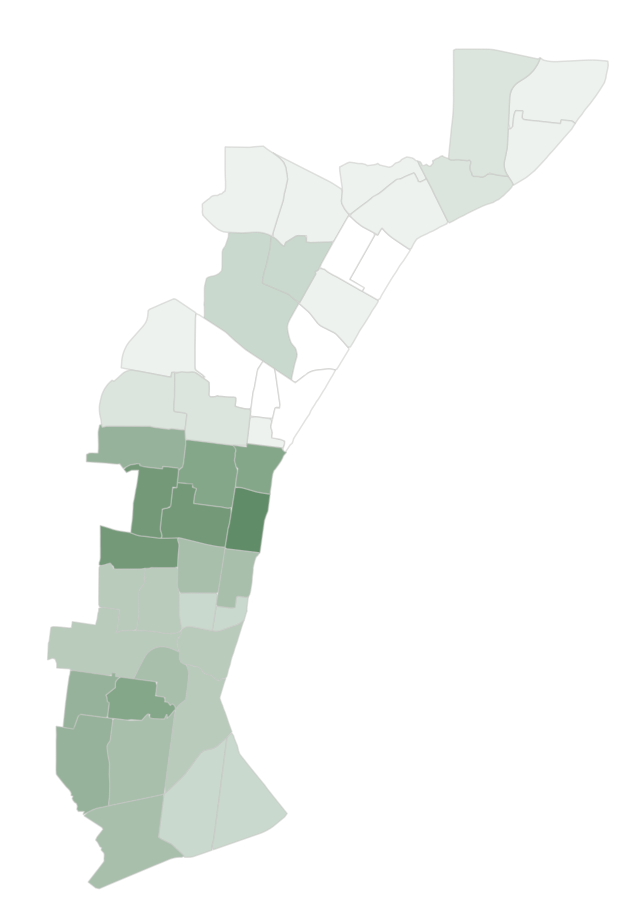
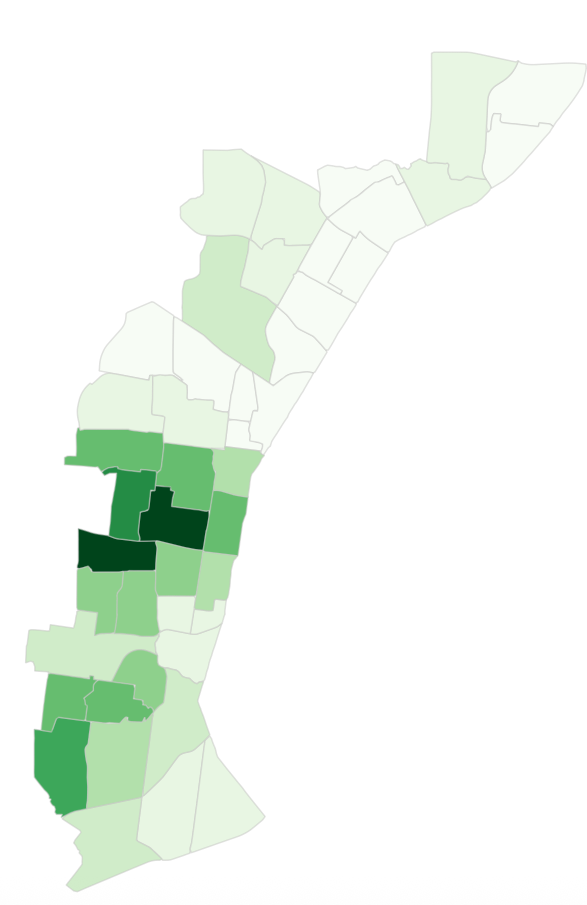
Black Population
For the race tract we will use an expression to normalize the values so they are more comparable. In this case we will divide the variable estimation in a tract by the total population estimation in a tract. Innerring_tract_race
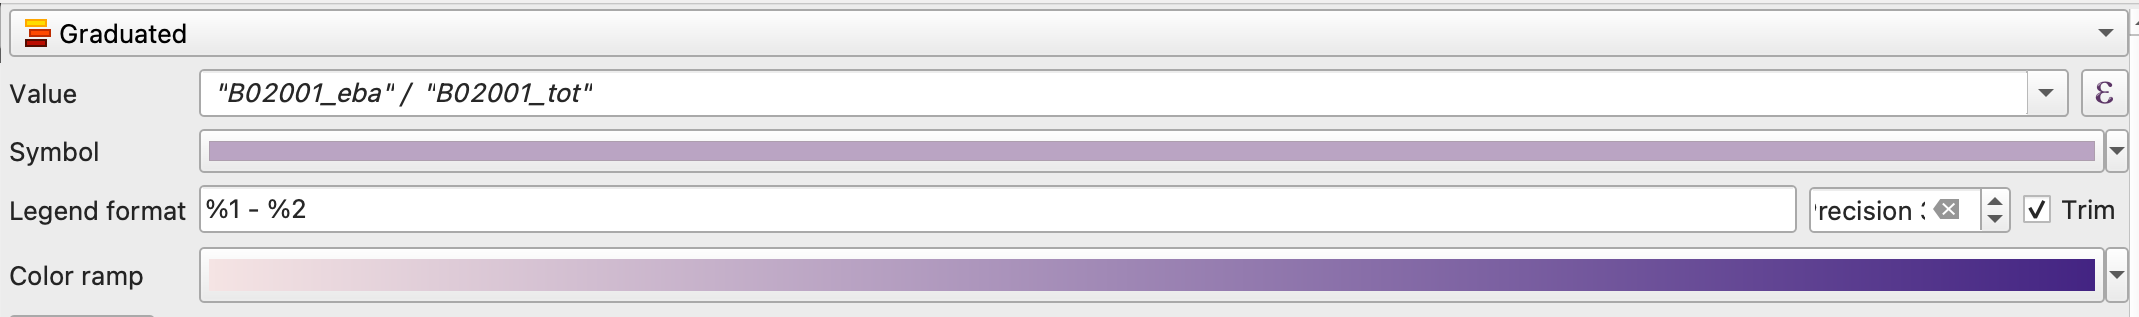
- Value: “B02001_eba” / “B02001_tot” (estimated black population/total population). To get this value click the expression button
- Mode: Natural Breaks
- Classes: 10
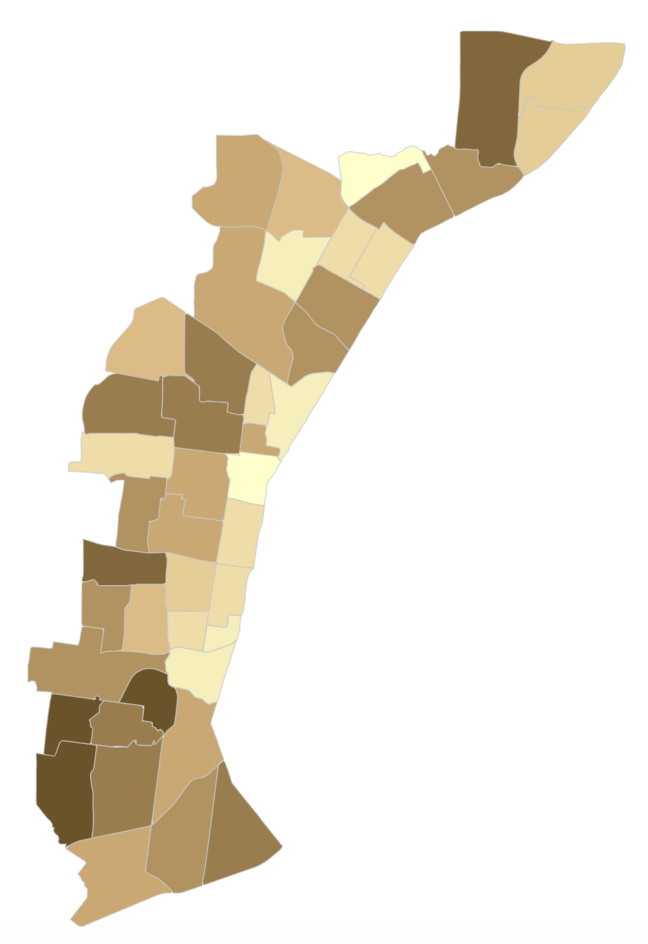
Mean Housing Value
Innerring_tract_housing
- Value: DP04_estme (mean housing value)
- Mode: Natural breaks
- Classes: 10
Households which are Owner Occupied
- Duplicate the innerring_tract_housing layer
- Rename the layer innerring_tract_housing_oo
- Value: DP04_prcto
- Mode: natural breaks
- Classes: 10