
Chapter 10: Adding Data
Adding Data in QGIS
You should already have downloaded QGIS. This chapter will focus on adding our data to QGIS, basic map formatting and getting to know the tool’s basic functions.
This chapter is completely focused on add geospatial data. Some of the data are in shapefile format, so those data are easy to add. Other data are in the form of services, which requires adding via url.
We’ll also bring in tables, which aren’t quite geospatial, but have information in them to transform them to a geospatial layer.
In this chapter, we will also begin the practice of ensuring data are in the correct projected coordinate reference system.
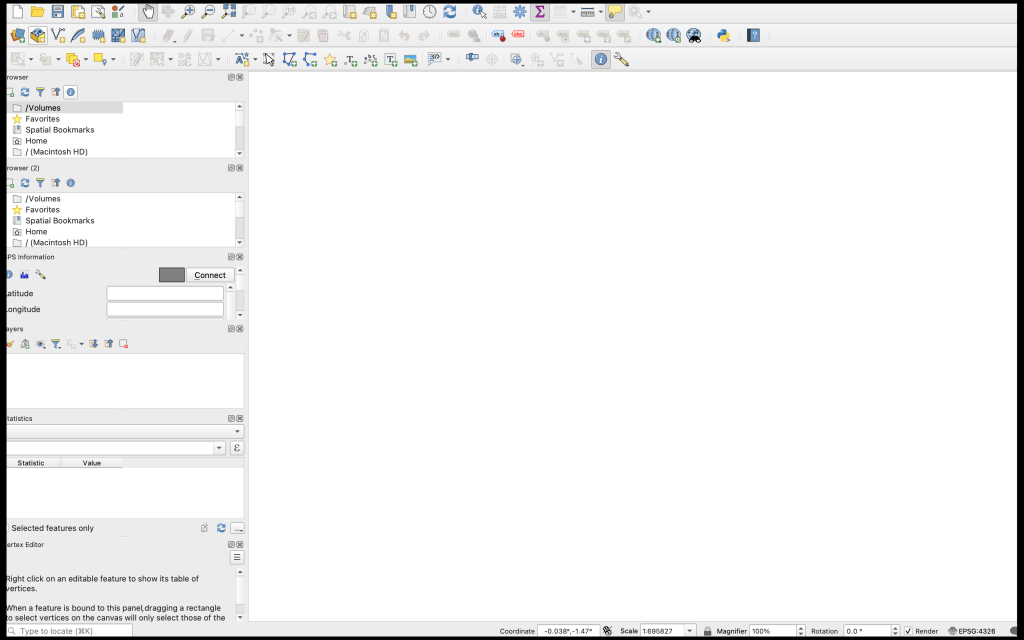
Step 1. Launch QGIS.
Your workspace should look something like this
Tool Tour
Some of these tools we will use much more frequently that others. There are also other tools not in this tool bar that we will leverage, and plugins that we will install along the way.
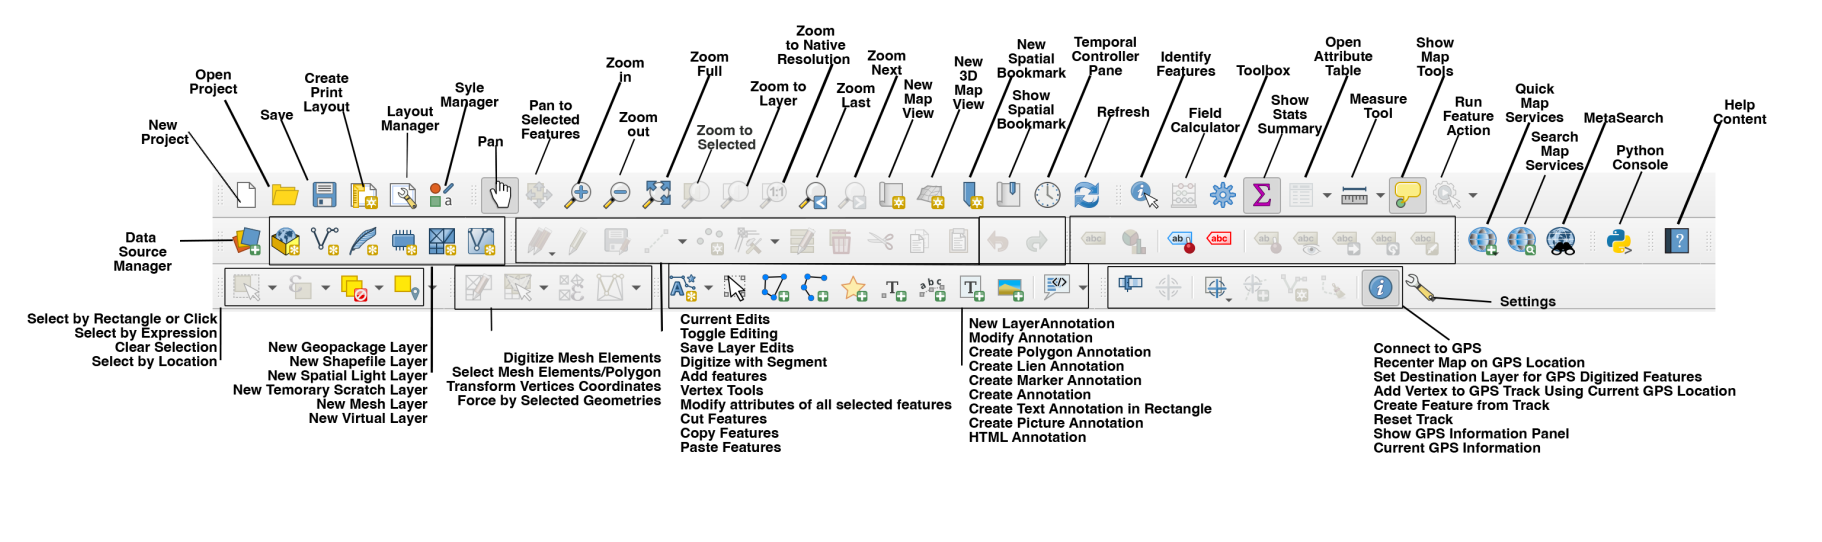
Commonly used tools include
- data storage manager
- zoom and pan
- identify features
- new map view (layout)
- refresh
- save
Datasets
If you are not finding and cleaning the data yourself, you can find the exercise data through an external site.
Step 2: Drag and Drop
Drag the .shp files from your external file manager and drop them into QGIS in this order:
- stlco_muni_bdy
- stlco_fema_floodway
- stlco_parcels
- stlco_transport
Step 3: Browse to Layer Using the Data Manager
Use the data source manager within QGIS
- Click the file manager icon
- In the left-hand menu click the Vector tool
- Navigate to the .shp file, double click
- Accept the encoding defaults
- Click add
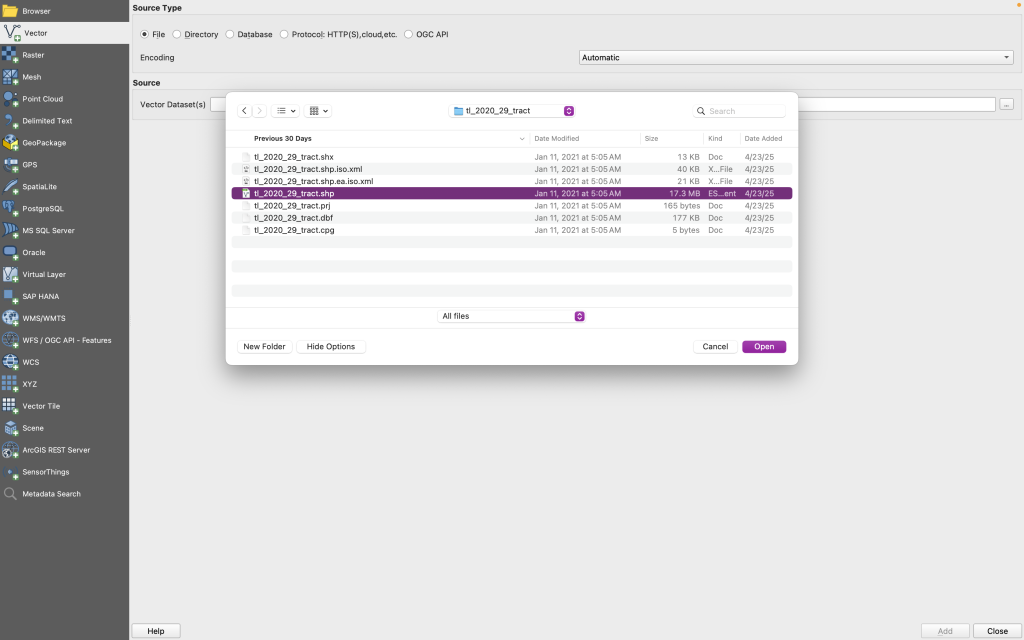
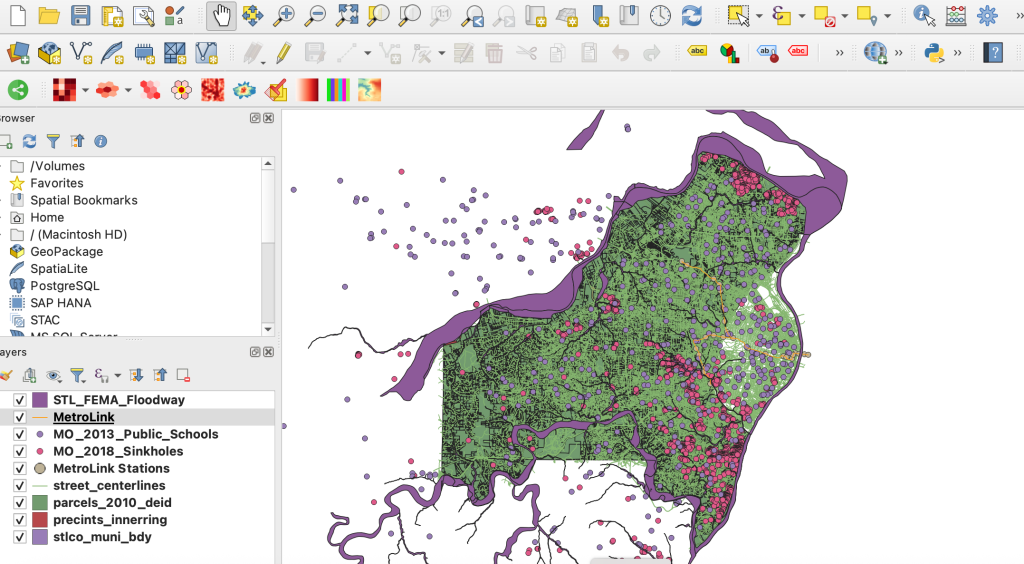
The shapefile layer will appear in the workspace.
Add remaining geometry datasets
- tl_2010_29189_tract10
- mo_2018_sinkholes
- mo_public_schools
Step 4: Check and change the Coordinate System
- Right click on the layer to view the CRS
- The CRS should be: ESRI:102696 – NAD_StatePlane_Missouri_East_FIPS_2401_Feet
- EPSG is an index of coordinate systems. You can look up an EPSG number at https://epsg.io/
- Any layer not in the above projection should be exported with it.
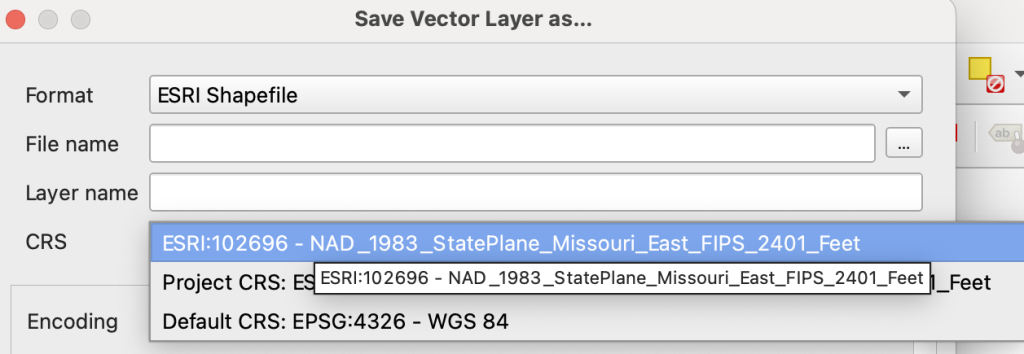
- Right click on the layer again and choose to Export, and then Save Features As
- Name the same but add a “_p” and make sure it’s in the correct folder.
- Use the CRS picker to choose the right projection, which we found in EPGS.io.
- Once we have put one layer in that projection, we can use that layer to assign projections.
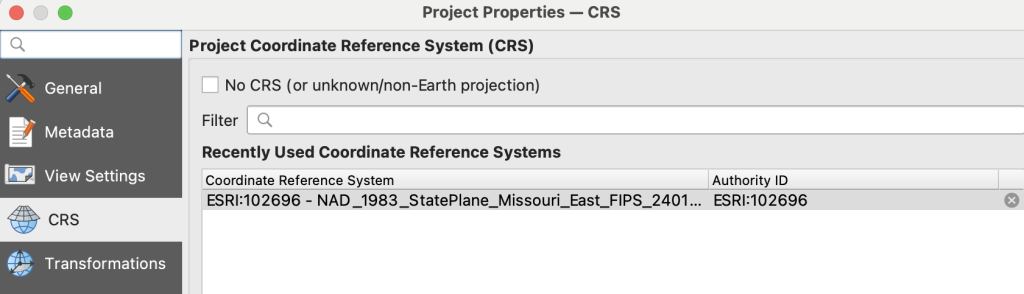
- Ensure the project is also in the ESRI: 102696 – NAD_StatePlane_Missouri_East_FIPS_2401_Feet projection.
- Go to Properties
- CRS
- Recently Used Projections Systems
- Select: ESRI:102696 – NAD_StatePlane_Missouri_East_FIPS_2401_Feet
- Go to Properties
Step 5: Add a basemap (optional)
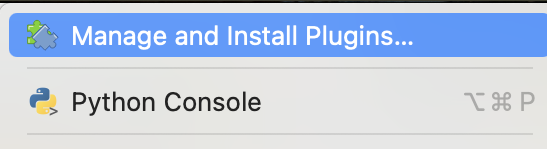
- Go to plugins
- Manage and install plugins
- Search for quickmapservices, install the plugin
- Under Web in the toolbar, an option for QuickMapServices will now appear.
- Go to QuickMapServices, OSM, OSM Standard
Step 5: Add Coordinate Data

We’ll start with our dataset which contains locations of ice cream shops, coffee shops, and juice bars.
Use the data source manager within QGIS
-
-
- click the Delimited Text tool

Use the delimited text option in the file manager. - Navigate to: cafe_juice_ic.csv
- File Format: comma separated values
- Geometry Definition: Point Coordinates
- o X field: Latitude
- o Y field: Longitude
- Geometry CRS: WGS 1984
- Add
- Close
- click the Delimited Text tool
-
The points are placed in the workspace, but we need to project them into our local coordinate system, ESRI:102696 – NAD_StatePlane_Missouri_East_FIPS_2401_Feet
- Right click on the new layer. Export
- Save features as
- File name: cafe_juice_ic_p.shp
-
- CRS: ESRI:102696 – NAD_StatePlane_Missouri_East_FIPS_2401_Feet
- OK
- Right click and remove layer: cafe_juice_ic (don’t remove cafe_juice_ic_p)
-
Step 6: Install Geocoding Plugin:
Before we can Geocode in QGIS, we must install a plugin.
-
-
- Go to the Plugins menu in the top tool menu
- Select Manage and Install Plugins
- Search for mmqgis
- Install plugin: mmqis will be added to the top tool menu
-
MMQGIS is a set of Python plugins for manipulating vector map layers in Quantum GIS: CSV input/output/join, geocoding, geometry conversion, buffering, hub analysis, simplification, column modification, and simple animation.
Step 7: Geocode Addresses
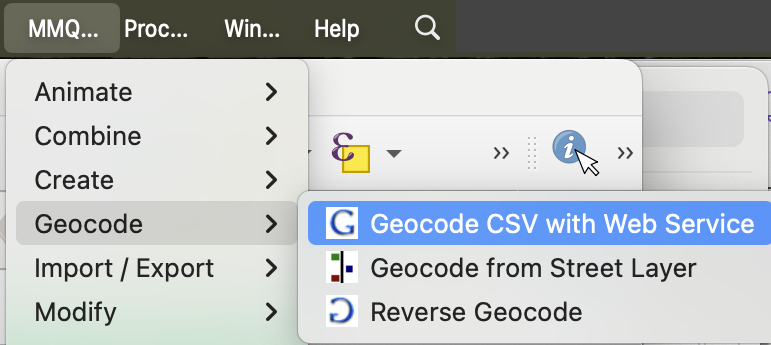
In the menu bar, go to MMQGIS
- Geocode CSV with Web Service
- Input: navigate to bakeries_clean
- Match fields in table to the web service geocoder
- Address: Address
- City: City
- State: State
- Country: Country
- Web service: Open Street Maps / Nominatim
- Duplicate Handling: Use only first result MMQGIS
- Output: data folder in your directory
- Not found Output: data folder in your directory (using mmqgis, you will double check the addresses that didn’t match outside of the GIS)
- Export the temporary layer using the same process as we did in the last layer we exported using the same CRS, named bakeries_clean_p
