Chapter 14: Kernel Density Estimation
Step 2: Density Analysis Plugin
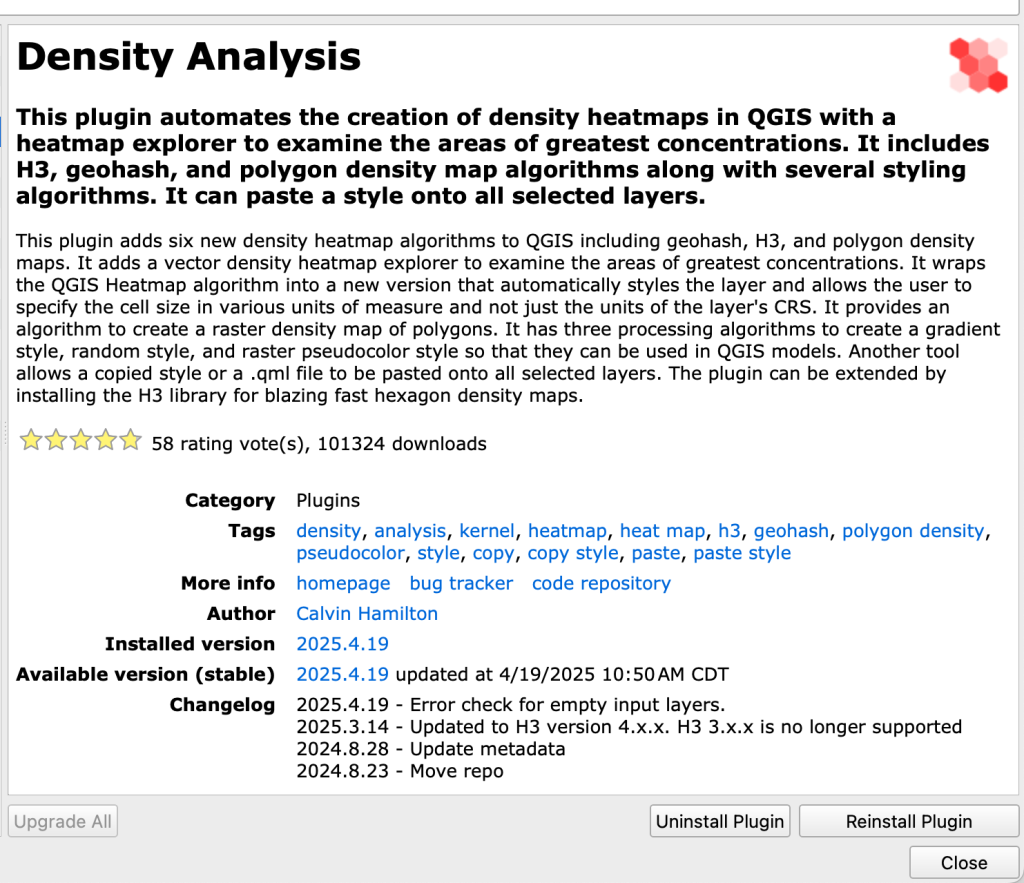
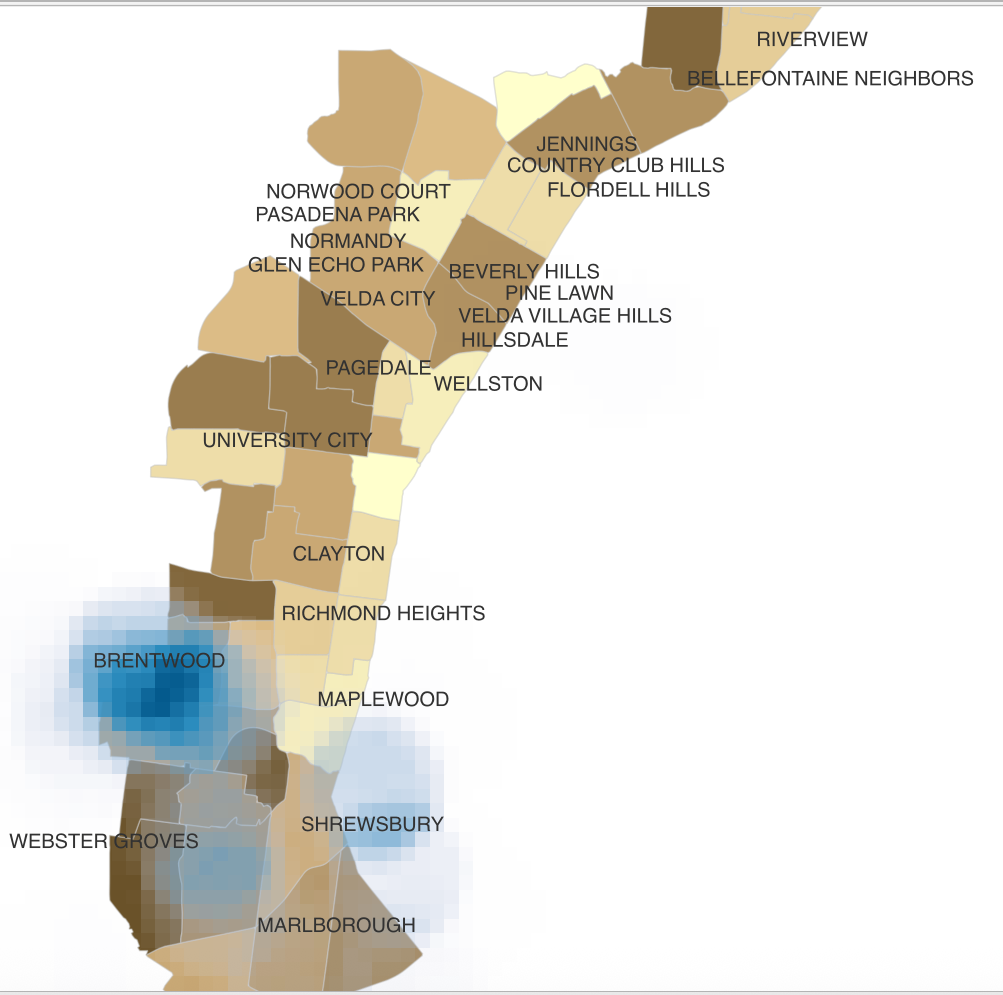
A very useful tool for demonstrating density of a phenomenon is to run Kernel Density Estimation (KDE). KDE measures density of features in relation to their neighborhood using weights. KDE can be used for vector data and creates a smoothed, raster output. As of publishing, QGIS does not have a KDE tool out-of-the-box but you can add the Density Analysis plugin.
- In the Top menu bar, go to Plugins
- Search for Density Analysis
- Install plugin

When the plugin is successfully installed you will see a new toolbar in your workspace.
Step 3: Kernel Density Estimation
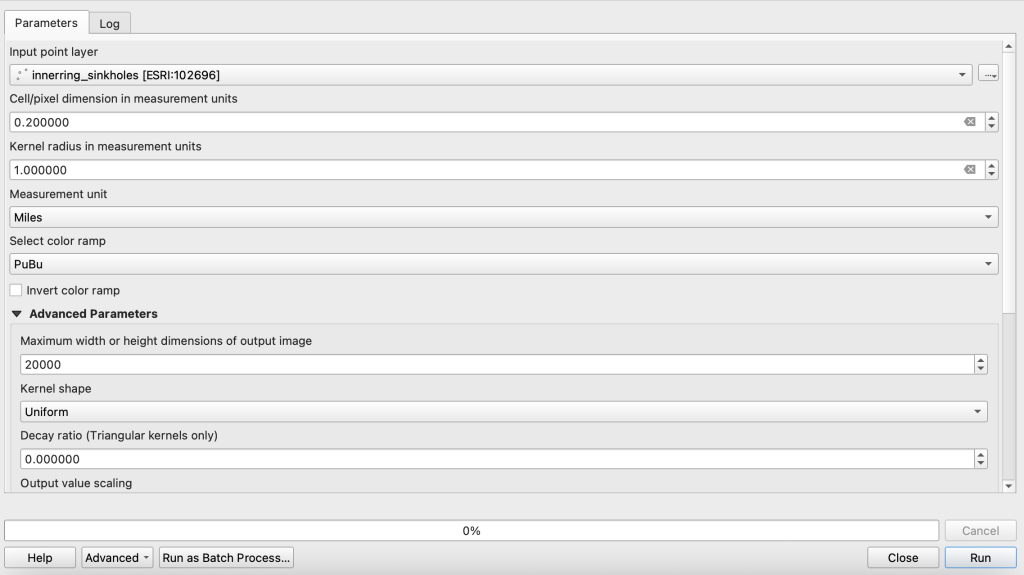
- from the Density toolbar, click the Raster Density tool
- Input point layer: innerring_sinkholes_2018
- Cell/pixel dimension: .1 (the higher the value, the lower the resolution)
- Kernel radius: 1.0 (this is the search distance)
- Units: miles
- Color ramp: you choose
- Kernel shape: uniform (feel free to try other shapes)
- Decay ratio: default
- Output value scaling: default
- Interpolation: linear
- Mode: continuous
- Number of gradients: default