Chapter 16: Communicating the Message
-
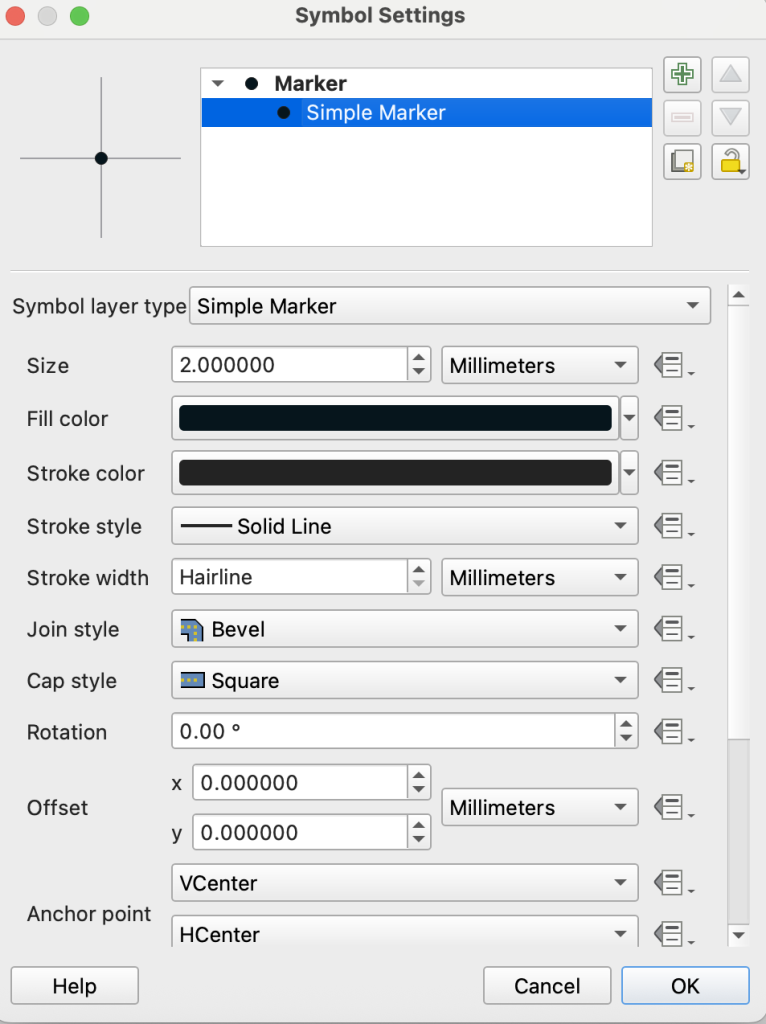
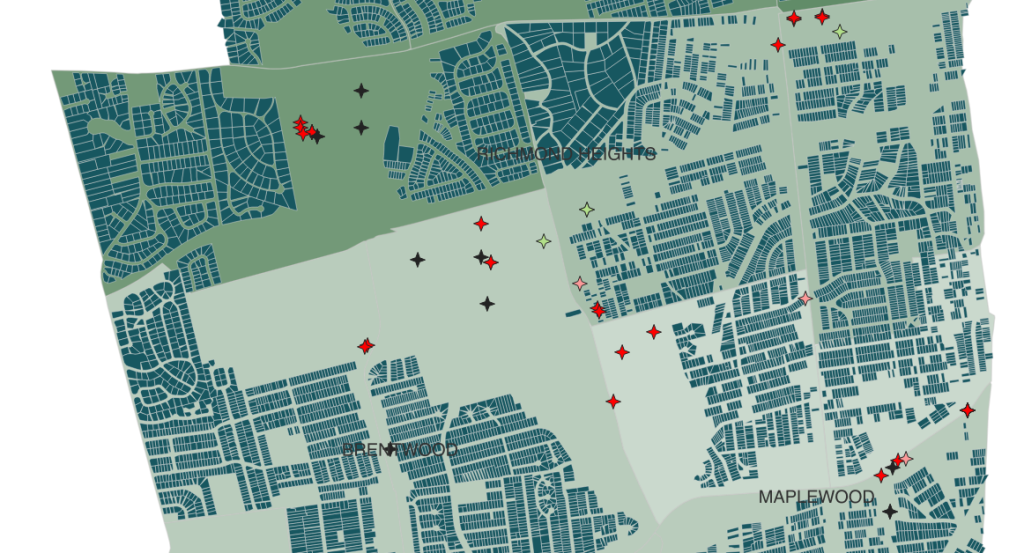
Screenshot of formatting all symbols in QGIS Now that we have done some basic analysis it’s time to share some of the insights we’ve made. Through doing the work, we may have had some insights, and we’ll probably have more as we put things together. Some reminders:
- Everything doesn’t have to go in one map; be sure to curate what information is going into the map
- Color choices are important
- Some features only use certain colors, e.g., water is blue
- Using non-neutral colors can relay meaning, be aware when using colors that have meaning to provide the context for the use
- Be sure to include information that helps your reader understand the meaning
Communication Checklist
- Meaningful title which helps readers contextualize the map.
- Legend which describes the features on the map.
- Scale bar that helps readers understand distance relationship between features on the map
- North Arrow which helps orient the view to its relationship / position in the world
- Credits which include who put this collection of data, analysis, inference, and communication together (you), the date or relative date it was created, the sources and dates of each dataset used, (Projected)
- Labels of features on the map that help the view understand the study area
- Coordinate Reference System
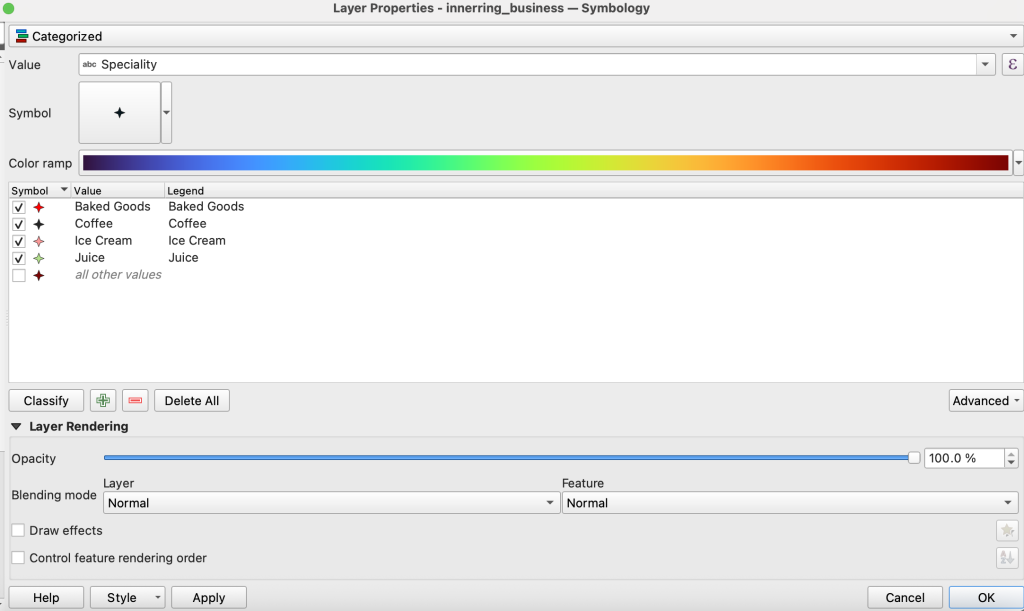
Screenshot of category symbology in QGIS
How to symbolize by Unique Values
We have already explored symbology by single symbol and by graduated colors, another common symbology is unique values. This is a method of visualizing a category defined it the attributes.
- Right click on innerring_businesses
- Go to symbology
- Select Categorized from the first dropdown menu
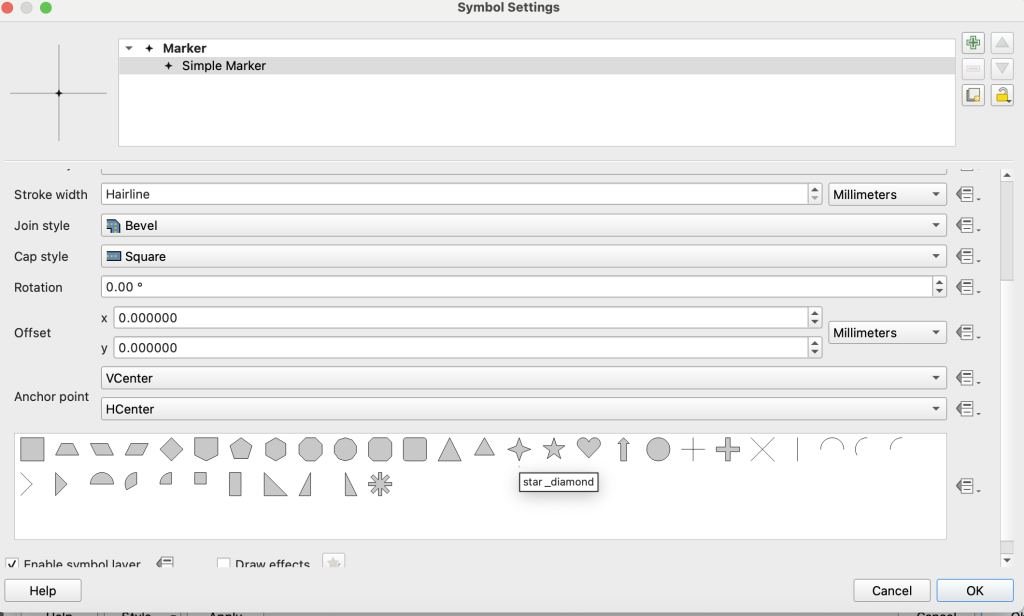
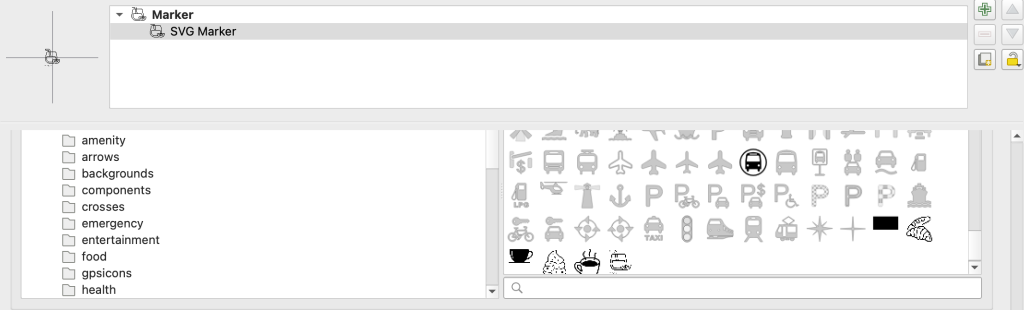
Screenshot of simple SVG marker in QGIS - Value: Specialty
- You can double click on symbol and change the symbol shape
- You can also change the stroke, icon size, and angle in this menu
- Each shape will get a different color, but have the same shape.
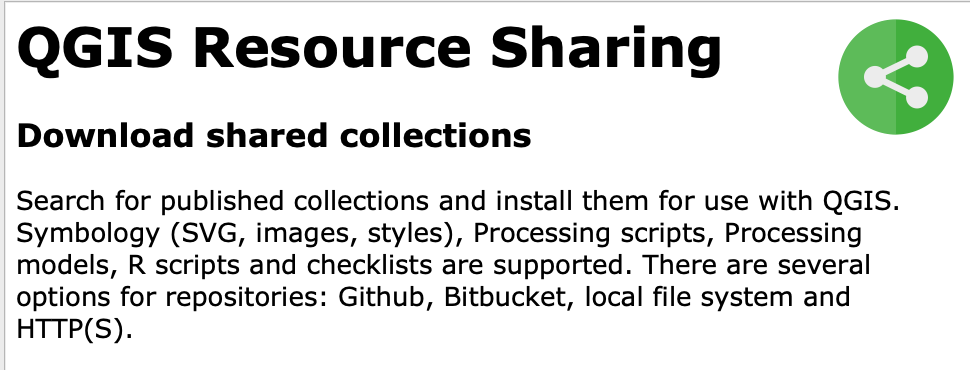
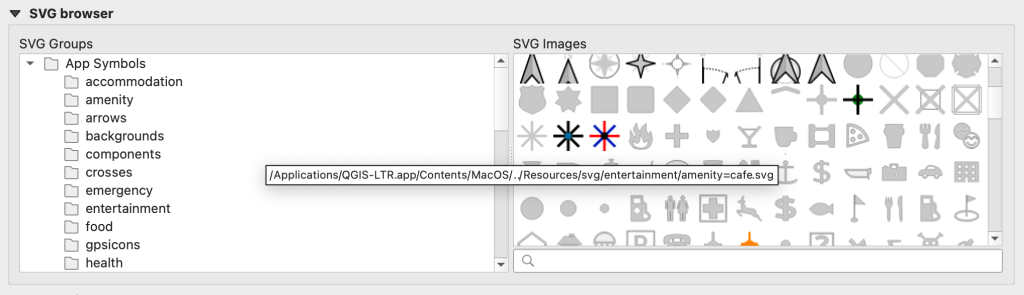
SVG collections
It’s possible to get a library of icons in QGIS, got to the plugins menu and install the resource sharing plugin.
- In the symbology dialog, click symbol
- Change the method to svg
- Scroll down to collection to the svg browser and choose an icon
Custom svg icons
It possible to upload custom icons.
Note, the image must be in .svg format and saved to your local directory
You can use the sample svg that are in the data folder for these exercises
In the QGIS project preferences
- Go to systems
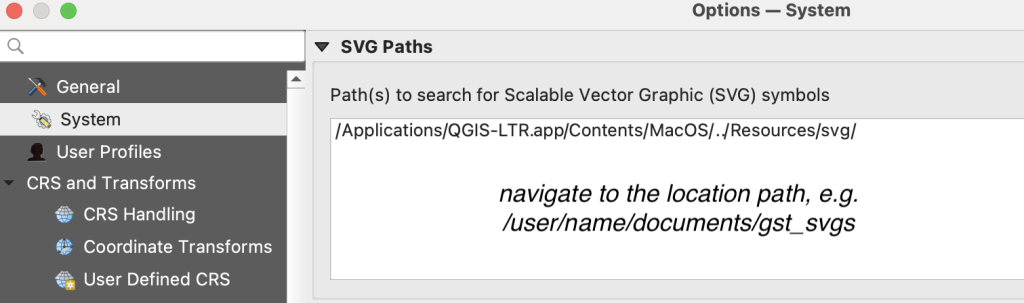
Screenshot of setting path to svg custom icons in QGIS - Navigate to the location where your .svg is stored
- Double click the symbol for baked goods
- Change the method from simple maker to svg marker
- Scroll down in the svg browser until you see the icons you added
- Double click the croissant press ok
Screenshot of browsing to custom svg icons in QGIS - Repeat for:
- ice cream
- juice
- coffee
| Custom markers adapted from Noun project |
 |
 |
 |
 |
|---|
How to label
It’s often not possible to label everything on your map, but strategically naming features on your map, can help the user. In the case of the municipalities, we may not have the feature symbology showing prominently, but we can label them to give views a relative idea of where they are.
- Double click innerring_muni_ds
- Select labels
In the first drop-down menu we must select how features will be labeled, the options are:
- None – no labels for a feature layer are the default
- Single – if we label feature, this is the most common choice, you might label by the feature name for example
- Rule based – this option allows us to create an expression for how the features should be labeled.
- Blocking – this allows us to determine the feature to label priority.
Select rule-based
- Use the plus sign at the bottom to add a rule
- Use the create expression button to create the rule
- The expression should be “MUNICIPALI” IS NOT ‘UNINCORPORATED’
- OK
Create a Layout
I’m going to create a few layouts based on what I’ve learned.
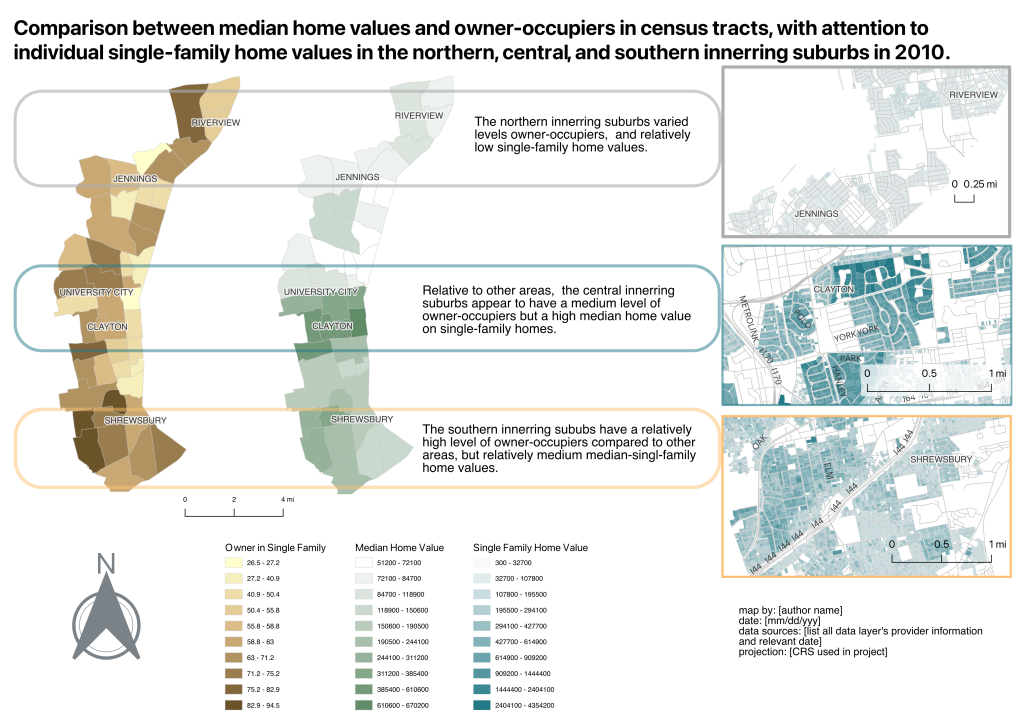
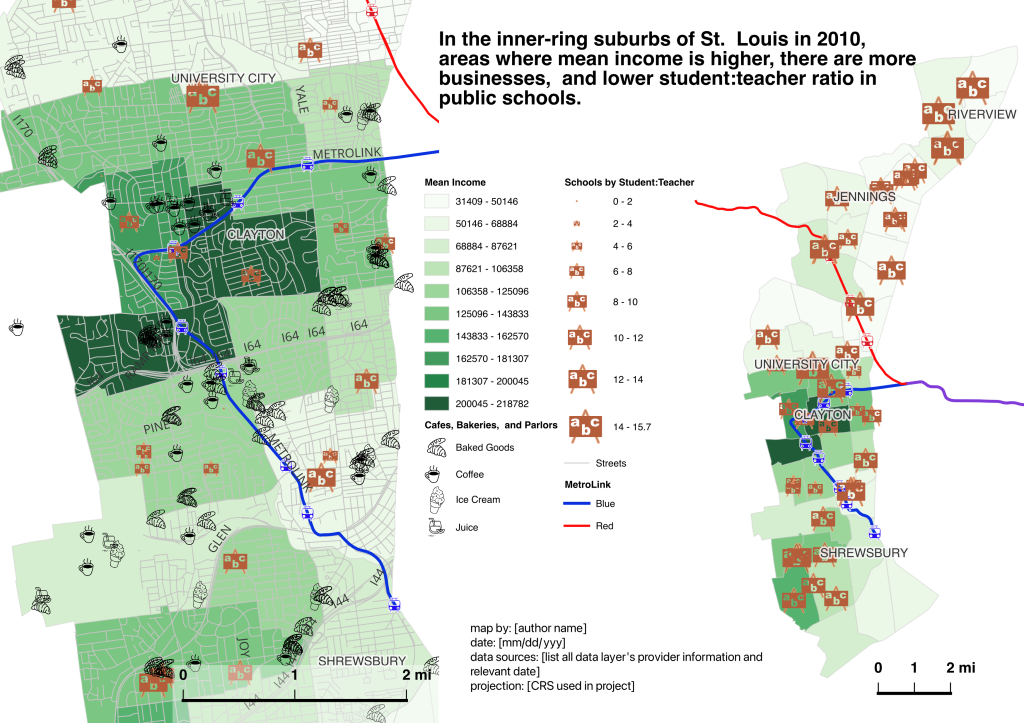
Map 1: Locations of Businesses, Schools by Student/Teacher Ratio, and Mean Income
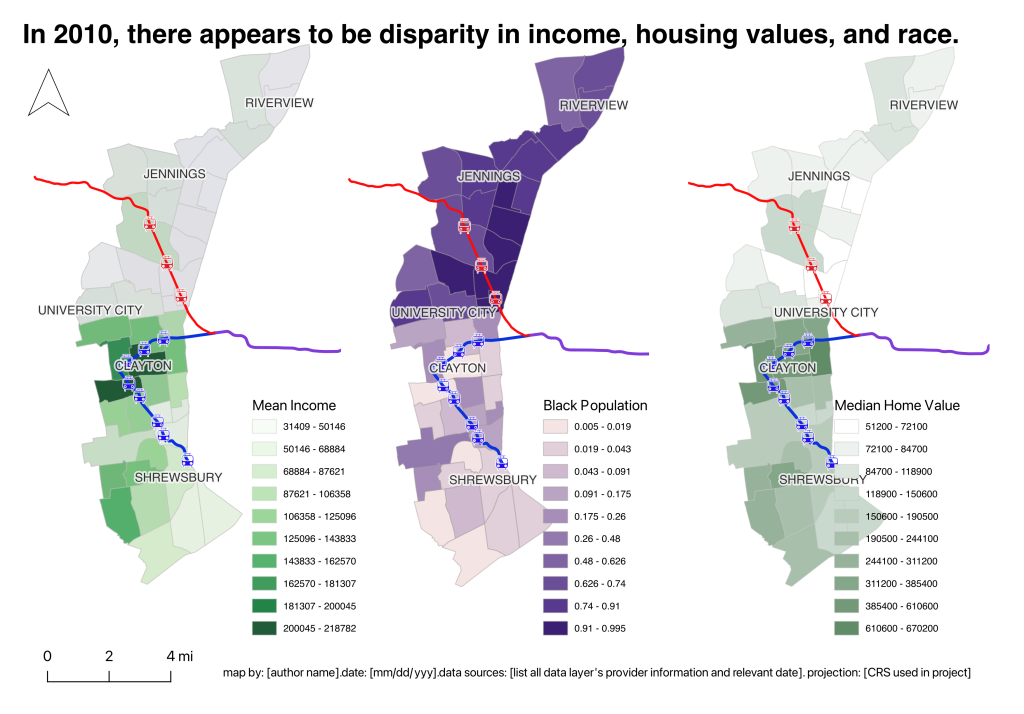
Map 2: Comparison between mean income, race, and housing values in census tracts in 2010.
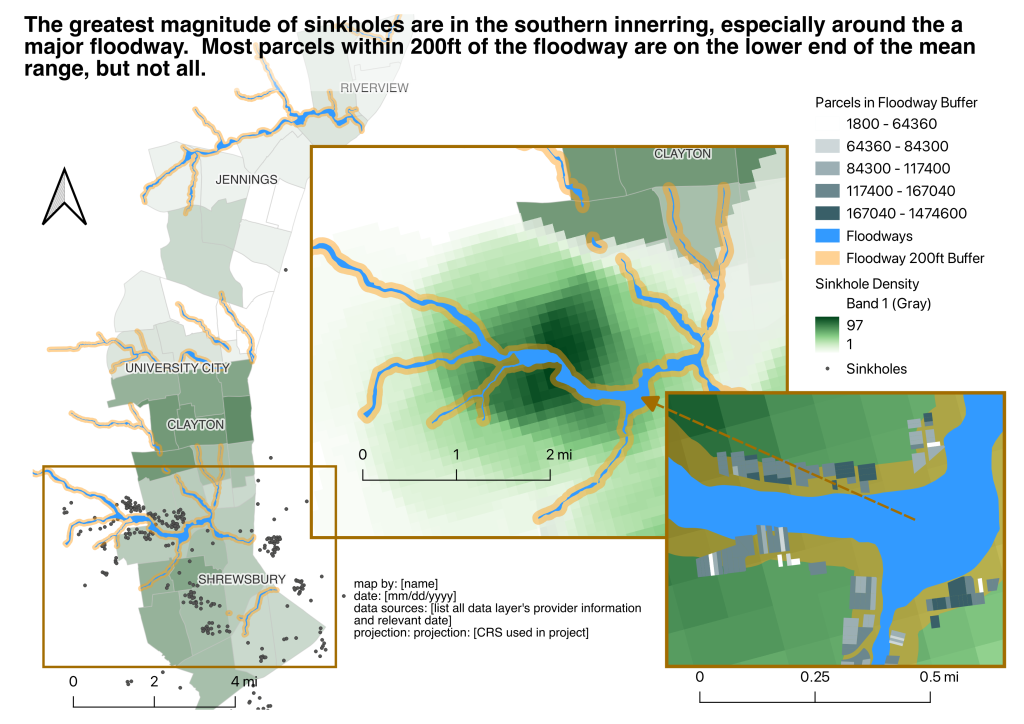
Map 3: Median home values in 2010 census tract and the relationship to floodways, and sinkholes.
Map 4: Median home values in 2010 census tract and the relationship to owner occupancy and individual single-home values